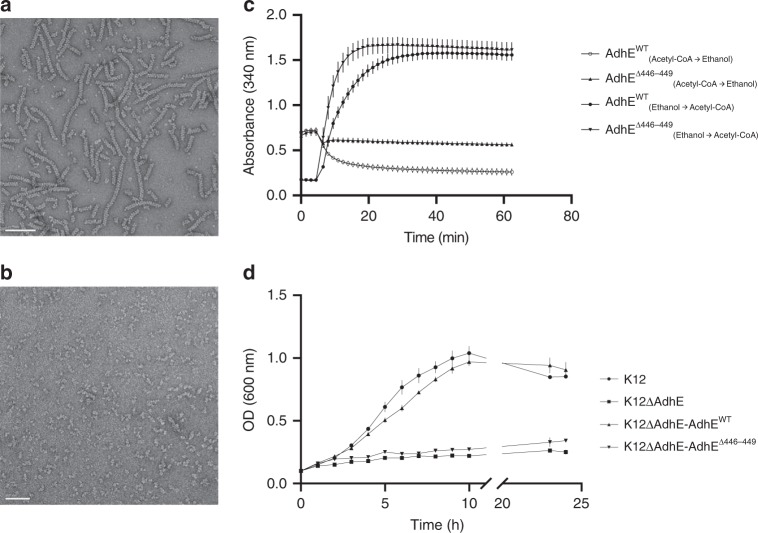
Fig. 6. Functional analysis of AdhE in vitro and in vivo.
a Negative stain electron micrograph of purified Wild-Type AdhE filaments. Scale bar 100 nm. b Negative stain electron micrograph of purified ∆446–449 AdhE filaments. Scale bar 50 nm. c Enzymatic assays monitoring AdhE activities of Wild-Type and ∆446–449 mutant AdhE. The conditions of each assay are indicated in the legend of the graph. The errors bars show SEM (3). d Growth curves for K12 E. coli strains in fermentative conditions in minimal medium. The strains used are indicated in the legend of the graph. The errors bars show SEM (3).

