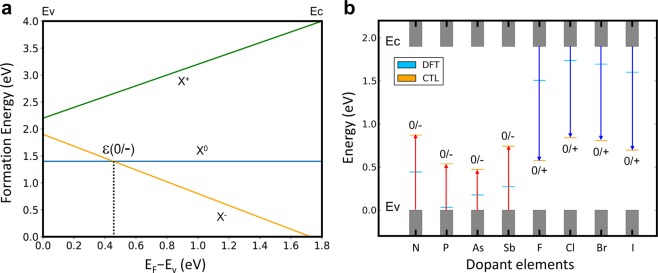
Figure 2.
Charge transition levels (CTLs) based on DFT total energy methods. (a) Illustrative description of CTL. Formation energies of impurity (X) at different charge states, i.e. +1, 0, and −1, are shown as a function of Fermi level (i.e., electron chemical potential). The Fermi level at the crossing point of the two lines designated by X° (blue) and X− (orange) is the CTL ε(0/−) from neutral state to negatively charged state. (b) Calculated CTLs based on the DFT total energy method are indicated by orange bars with the mark 0/+ or 0/−. For clear comparison, KS eigenvalues of impurity states are also shown (blue bars). Valence and conduction bands are represented by gray shaded columns. Here, valence band maximum is set to be the reference energy. The red (blue) arrows indicates how much the Fermi level should change with respect to valence band maximum (conduction band minimum) to induce the charge state transition of the impurities.

