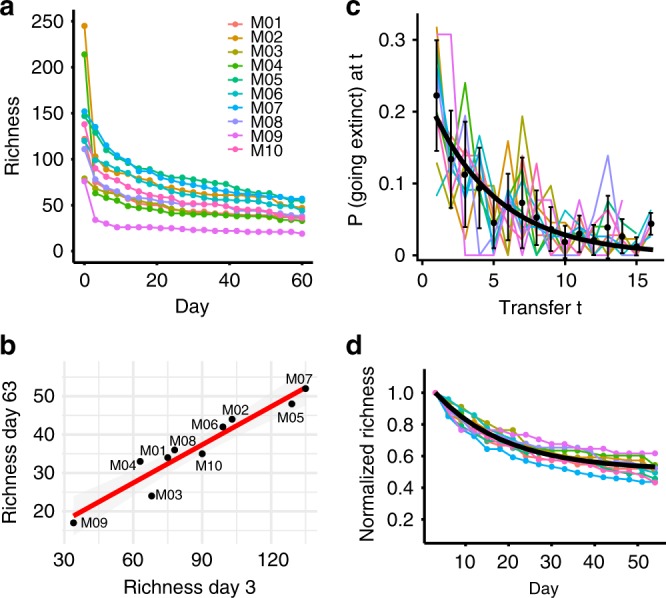
Fig. 2. Early richness predicts final richness and communities equilibrate at a common rate.

a Richness over time for each microcosm community. b Richness on Day 3 (1st timepoint) is strongly correlated with richness on Day 63 (21st timepoint). Linear model: R2 = 0.9008, p = 1.714 × 10⁻⁵. c The probability of going extinct at transfer t. Colored lines are probability densities for individual microcosms. Black points are averages across microcosms, the black line is the maximum likelihood distribution with a common parameter across microcosms (see main text and Methods) given by the inverse mean extinction time. d Richness over time for each microcosm community, normalized by the richness on Day 3. The black line shows the exponential decay curve parametrized by the mean proportion of surviving ASVs (from b) and the common ASV extinction rate (from c).
