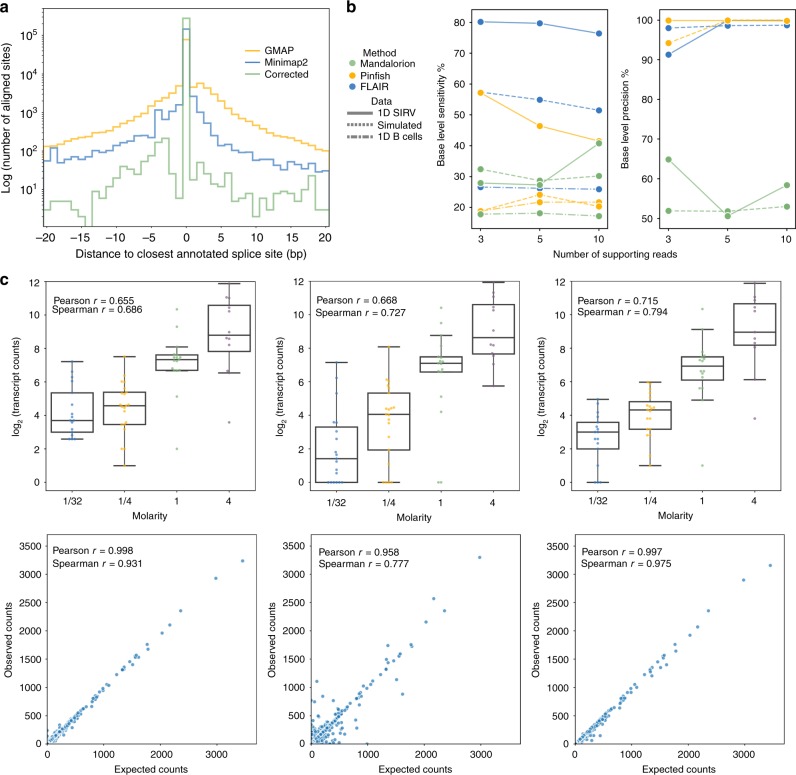
Fig. 2. Evaluation of nanopore read alignment, correction, transcript assembly, and transcript quantification.
a Histogram showing the distance between splice sites determined using the GMAP (yellow) or minimap2 (blue and green) spliced aligners to the closest annotated splice sites for a subset of the CLL SF3B1K700E reads; the minimap2 aligned vs annotated splice-site histogram was further distinguished between alignments that had (green) or had not (blue) been subject to FLAIR splice correction. b Base-level sensitivity (left) and precision (right) of isoform sets built using Mandalorion (green), Pinfish (yellow), or FLAIR (blue). Each software tool was run with varying supporting read thresholds (x-axis) on either nanopore-sequenced 1D SIRVs (solid line), a set of simulated nanopore transcript reads (dashed), or 1D B cell reads subsampled down to 500,000 reads (dot dash). c Comparison of transcript quantification methods for nanopore reads plotting the expected and observed transcript abundances of the SIRV data (top row) and simulated data (bottom row). First column: counting primary alignments, second column: salmon given all alignments, third column: counting MAPQ ≥ 1 alignments. Box-plots show median line, box limits are upper and lower quartile, and whiskers are 1.5× interquartile.

