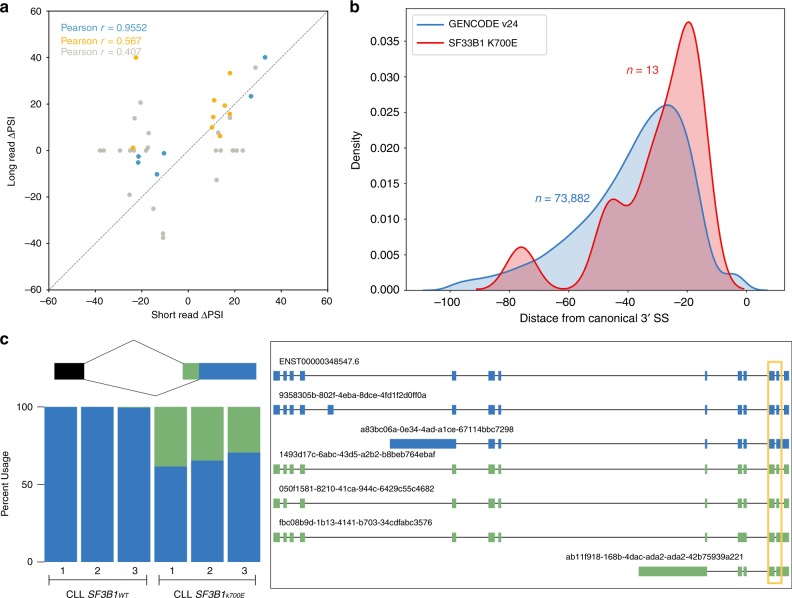
Fig. 3. Alternative 3′ splicing patterns identified with nanopore-sequencing data are concordant with short read data and reveal additional splicing complexity.
a Comparison of the delta PSI for significant alternative splicing events identified by juncBASE using short-read data and the median delta PSI of the same events using long-read data. The colors correspond to the median coverage of the splice junctions, where blue is greater than 25 reads, yellow is greater than 10, and gray is greater than 0. b Distribution of proximal splice sites found in nanopore reads for 13 significant sites (corrected p value < 0.10, delta PSI > 10). The GENCODE distribution is the distribution of distances from canonical 3′ splice sites to the nearest non-GAG trimer. Source data are provided in a Source Data file. c ERGIC3 splice-site usage (left) and full isoforms (right) for the proximal chr20:35,556,954 (green) and distal chr20:35,556,972 (blue) sites from 5′ to 3′. The dominant isoforms using either the proximal or distal site are 1493d17c-6abc and ENST00000348547.6. The alternative acceptor event is boxed in yellow in the isoform schematic.

