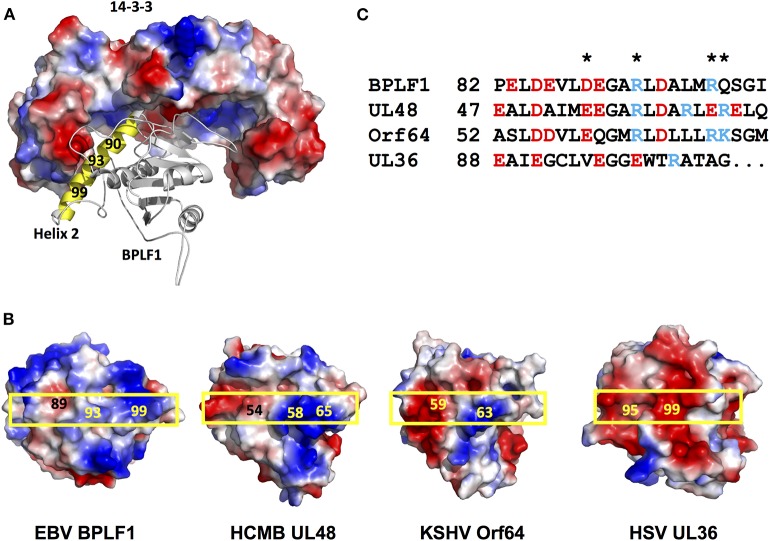
Figure 4.
Distribution of the charged residues on helix 2 of the viral deconjugases. (A) The Cluspro top hit three-dimensional molecular model of the binary complex of the 14-3-3 dimer (shown as surface colored by electrostatic potential: positive charge, blue; negative charge, red, non-charged, white), and BPLF1 (cartoon) illustrates how solvent exposed residues of BPLF1 helix 2 (yellow) may participate in complex formation. (B) The electrostatic surface potential of the molecular models of the N-terminal domains of the viral deconjugases reveal striking differences between UL36 and the other proteins. The position of helix 2 on the surface of each deconjugase is indicated by a yellow box. (C) Alignment of the helix 2 residues for the four different viruses. The charged solvent accessible residues indicated in 4B are highlighted (*).

