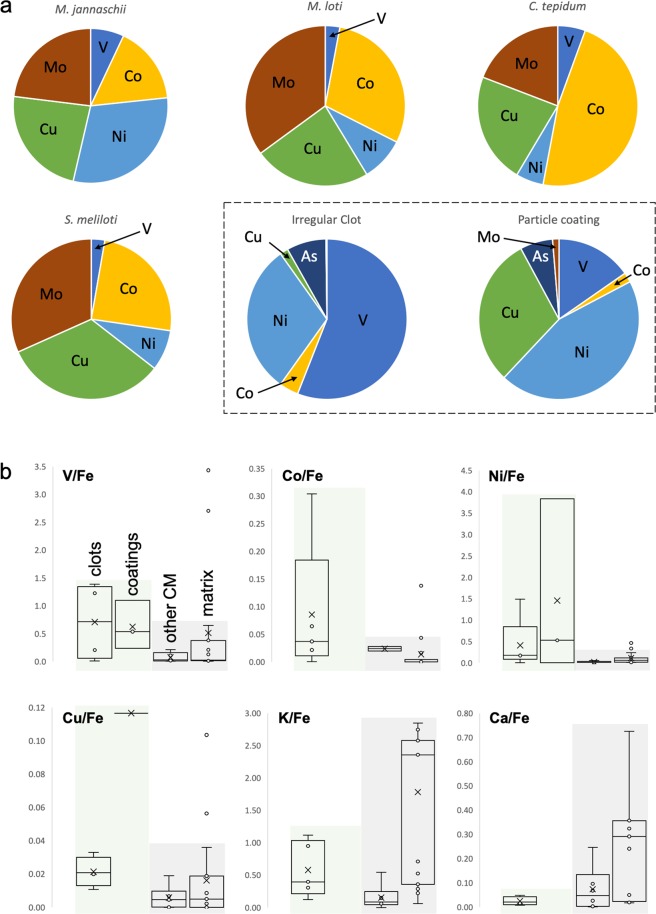
Figure 6.
Systematic approach to calculating the palaeo-metallome with reference to modern organisms. (a) Comparison between fractional contributions of elements of interest in Josefsdal Chert carbonaceous material and reported prokaryotic metallomes (e.g. Zerkle et al.41). A metallomic contribution of V, Co, Ni, Cu and As (with bio-essential Fe, not shown) is frequently seen in irregular clots and particle coating morphologies. The least deviating pattern is seen between that of M. jannaschii and Josefadal Chert carbonaceous material: V, Ni, Co, Cu and Fe, together with reduced (or absent) requirements of Mn and Mo. The higher dependency on Cu seen for S. tepidum and S. meliloti more closely aligns its intracellular metal abundances with carbonaceous material in particle coatings, but we suggest that Cu may not be integral to the Josefsdal Chert carbonaceous material, but instead be the result of non-specific uptake due to extracellular polymer-driven resistance to toxicity (after Hickman-Lewis et al.33). In most cases, the concentrations in putative biomass is lower than that for in vivo cells. This is consistent with degradation of biomass during the decay of cellular components. (b) Metal:metal ratios for the studied microstructures against values in the matrix demonstrating statistically distinct enrichments of V, Co, Ni, Cu, K and Ca. Enrichments in transition metals and depletions in Ca and K are consistent with bio-accumulation (i.e., in molecular nanomachines) and toxicity mitigation (i.e., against salt stress). The overall differences between significant metal enrichments in clots and coatings (highlighted in green) with respect to flakes and the matrix (highlighted in grey) implies that the accumulation of transition metals in flakes occurs by a different, less efficient process. We propose bio-accumulation for the effective accumulation of metals in clots and coatings, but passive, non-specific accumulation in the case of flakes. Passive accumulation is consistent with the similarity in metal:metal ratios in flakes and the matrix. Where no box plot is shown, either one or both of the elements in question were not present in the region of interest.

