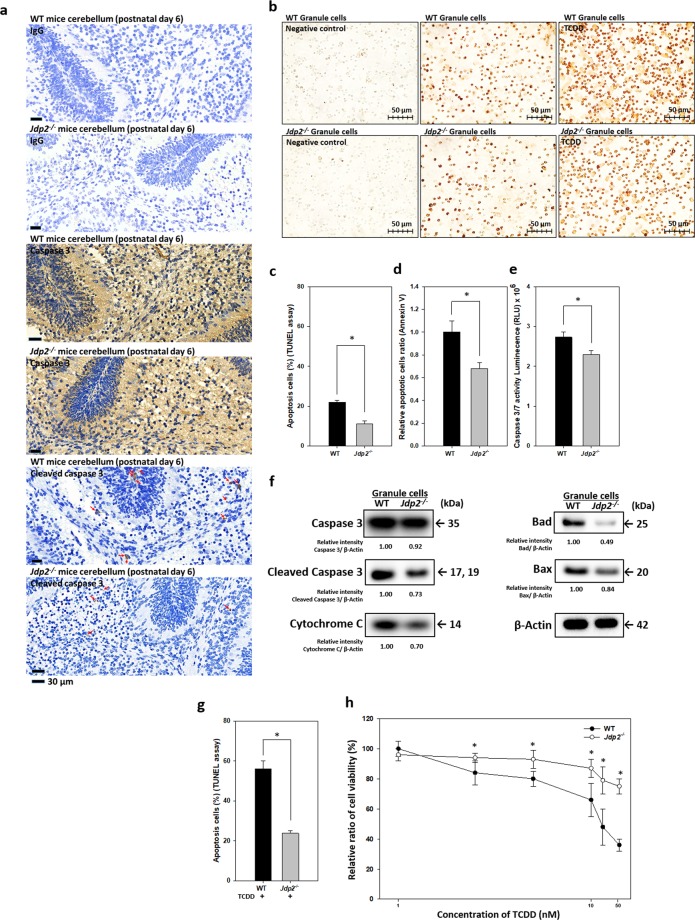
Figure 2.
Decreased apoptosis in Jdp2-KO GCPs. (a) Cerebellum sections from WT and Jdp2-KO mice were stained with anti-caspase 3 and anti-cleaved caspase 3 antibodies and with control IgG, as described in Materials and Methods. The red arrows indicate the granule cells stained by the anti-cleaved caspase 3 antibody. (b) GCPs from WT and Jdp2-KO mice were incubated with or without TCDD (10 nM) for 24 h, and the cells were stained for TUNEL assays as described in Materials and Methods. (c) Quantification of apoptotic cells from the images of panel (b). Each value represents the mean ± SEM (n = 3); *p < 0.05. (d) Annexin V staining of WT and Jdp2-KO GCPs was performed as described in Materials and Methods. Each value represents the mean ± SEM (n = 3); *p < 0.05. (e) Caspase 3/7 activities were measured in 3 × 10⁵ WT and Jdp2-KO GCPs in 96-well plates. Each value represents the mean ± SEM (n = 3); *p < 0.05. (f) Comparative expression of apoptosis-related proteins in WT and Jdp2-KO GCPs (n = 5). The right lane indicates the apparent molecular weight. The relative intensity of each band was calculated relative to β-actin. (g) Quantification of apoptotic cells in TCDD (50 nM)-treated WT and Jdp2-KO GCPs. Each value represents the mean ± SEM (n = 3); *p < 0.05. (h) Cell viability of WT and Jdp2-KO GCPs with increasing doses of TCDD (1.0‒50 nM). Each value represents the mean ± SEM (n = 3); *p < 0.05.

