
Figure 2.
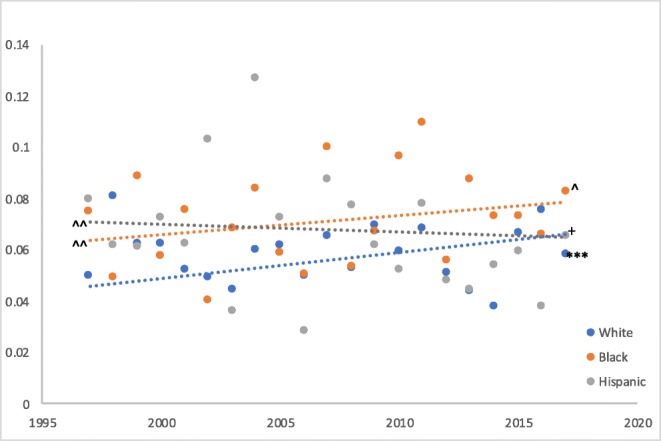
Age-adjusted prevalence of chronic kidney disease, 1997–2017. Trendline was created from logit predictions of the age-adjusted prevalence rates. Significance testing was done using the logit-predicted prevalence rates. Asterisk symbols indicate a statistically significant time trend (*p< 0.05; **p< 0.01; ***p< 0.001). A plus sign indicates statistically significant difference in time trends between White/Black and White/Hispanic patients. Upward-pointing arrowheads indicate statistically significant difference in predicted prevalence between White/Black and White/Hispanic patients in a given year (either 1997 or 2017).