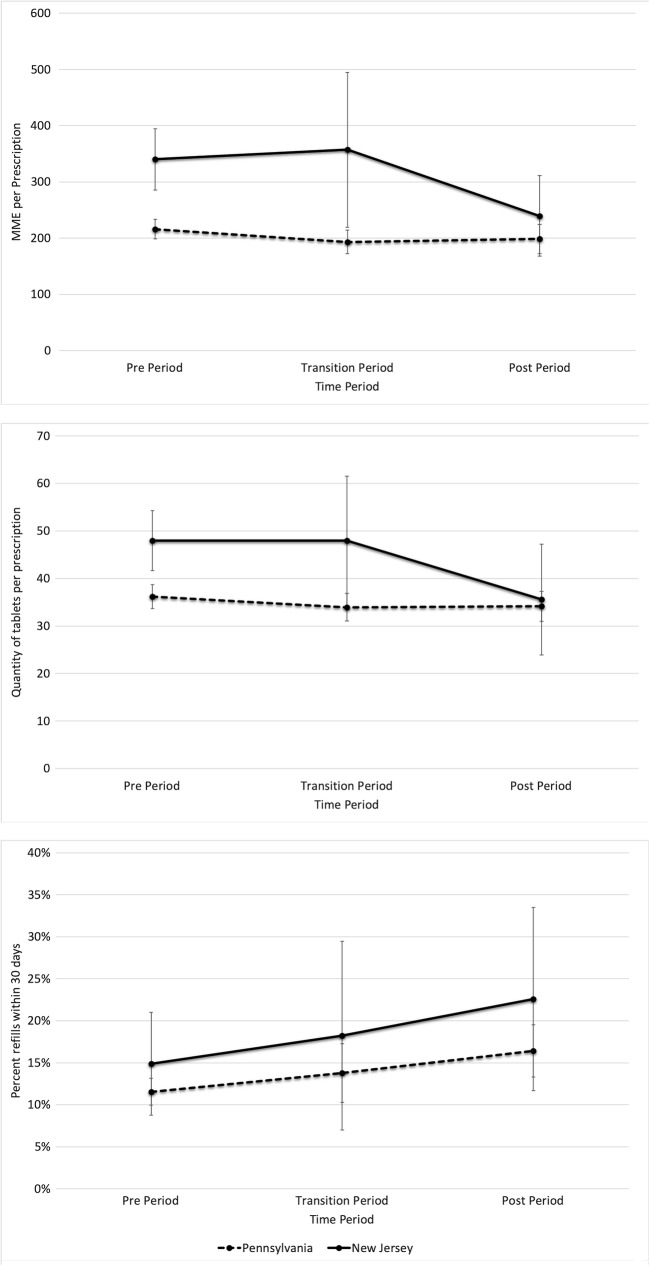
Figure 3.
Adjusted margins plot with 95% CI for a) MME per prescription, b) tablet quantity per prescription, and c) percent of prescriptions with refills at 30 days. The pre-period includes May 15, 2016–May 15, 2017; the transition period (prescribing limit law implemented but the EMR alert not in place) includes May 16, 17–July 7, 2017; and the post-period (prescribing limit and EMR alert implemented) includes July 8, 2017–March 14, 2018. Margins plots represent the mean values for outcomes in each period after controlling for calendar time, patient, and practice characteristics.

