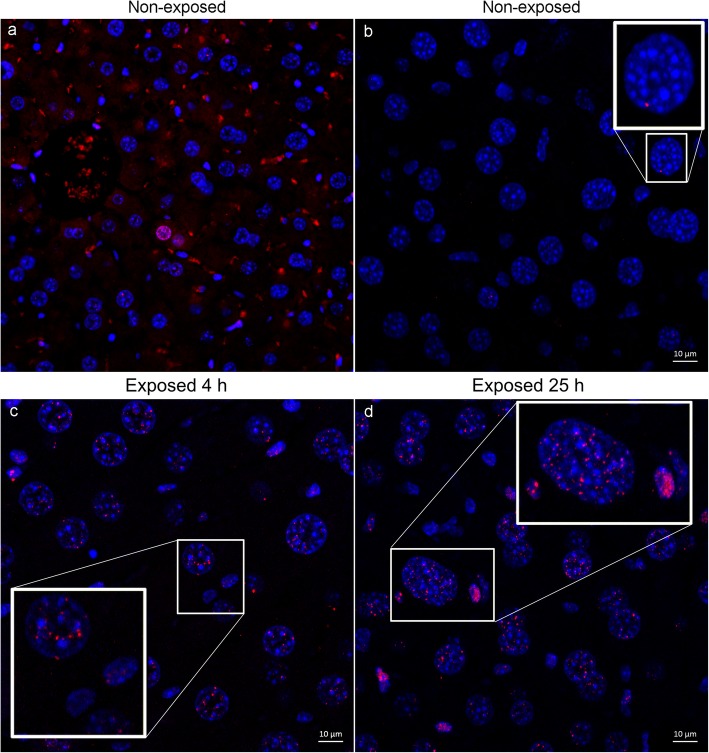
Fig. 2.
Confocal laser microscopy of liver sections. Representative illustration of images from a, b non-exposed animals, c animal 4 h P.I., and d animal 25 h P.I. Overview image in a taken with wide-field fluorescence microscope and in b–d with CLSM. Note the difference between the hepatocyte nuclei, which morphologically are large, with a circular cell nuclei and bright areas of heterochromatin regions compared with the non-hepatocyte nuclei, which are more elongated in shape and have more homogeneous nuclear staining. Images were adjusted for brightness and contrast. Scale bars in b–d 10 μm

