
Fig. 3.
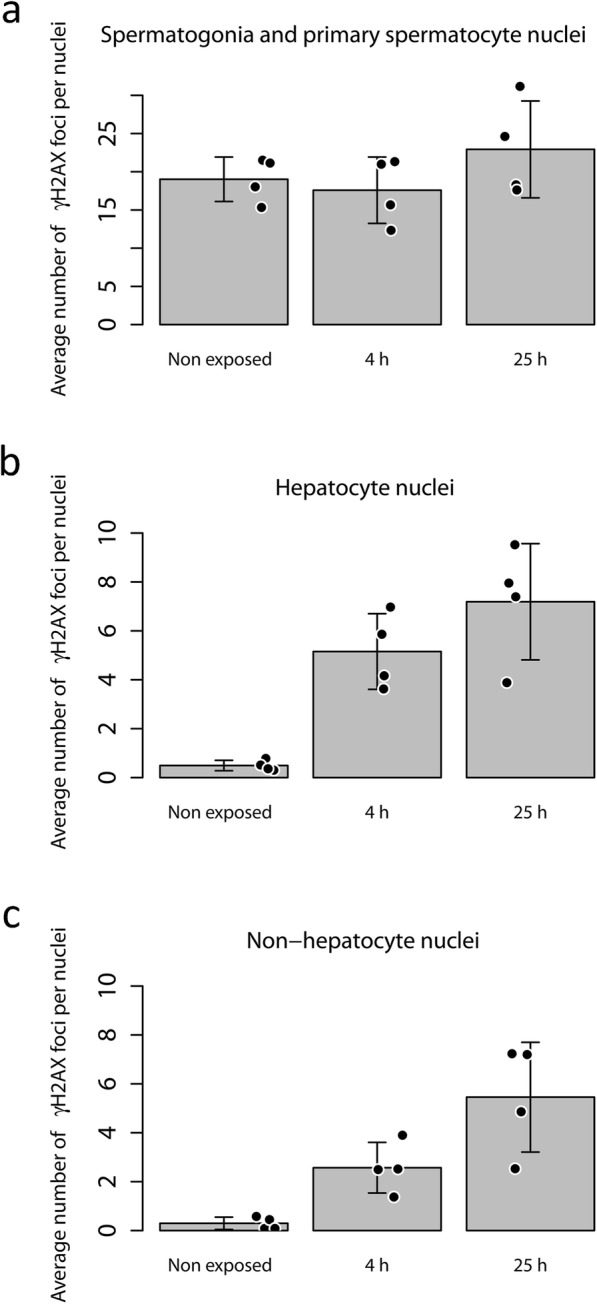
Bar plots illustrating the average number of γ-H2AX foci per cell nuclei for different groups of animals (non-exposed, 4 h P.I., and 25 h P.I.) for the a spermatogonia and primary spermatocytes, b hepatocytes, and c non-hepatocytes. The mean value for each individual animal within a group is illustrated by a black dot. The points have been randomly displaced along the horizontal axis to increase visibility; it should not be interpreted as a variation in time after injection