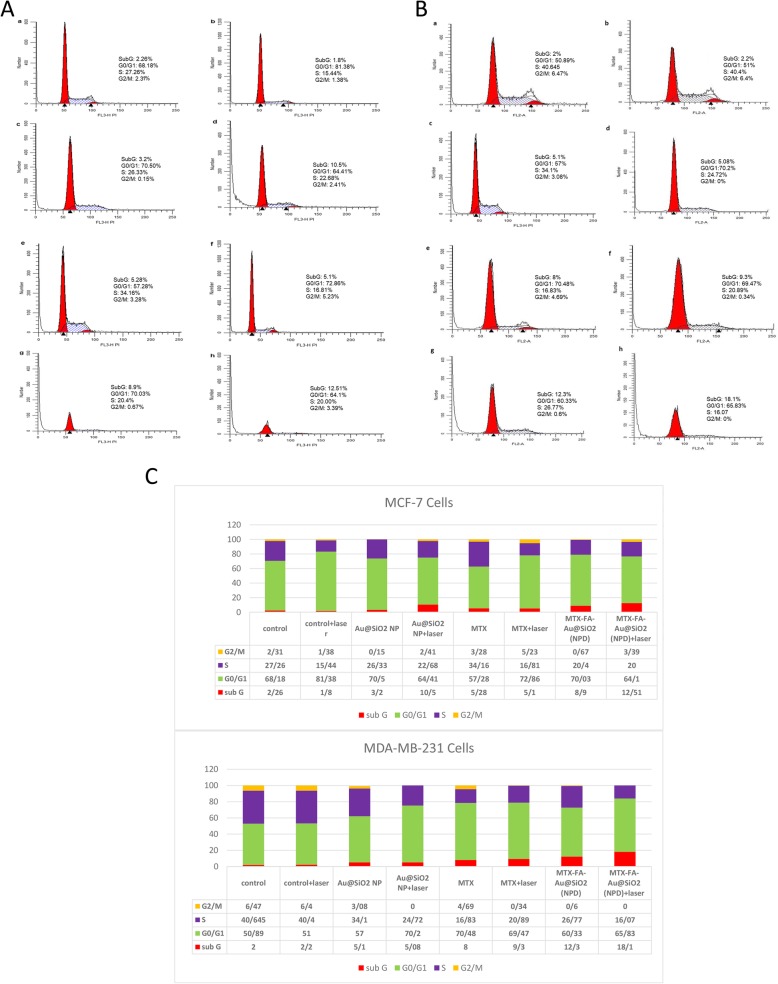
Fig. 9.
Cell cycle distributions investigated for MCF-7 (A) or MDA-MB-231 (B) cells. The untreated cells as negative control (a), cells treated with laser (75 J/cm2) as positive control (b) cells treated with Au@SiO2 nanoparticles (NP) (c), cells treated with laser (75 J/cm2) and Au@SiO2 nanoparticles (NP) (d), cells treated with MTX without laser irradiation (e), cells treated with MTX and laser irradiation (f), cells treated with MTX-FA-loaded Au@SiO2 nanoparticles (NPD) without laser exposure (g), and cells treated with MTX-FA-loaded Au@SiO2 nanoparticles (NPD) with Laser exposure (h), C) Quantitative results of cell cycle arrest and its distribution

