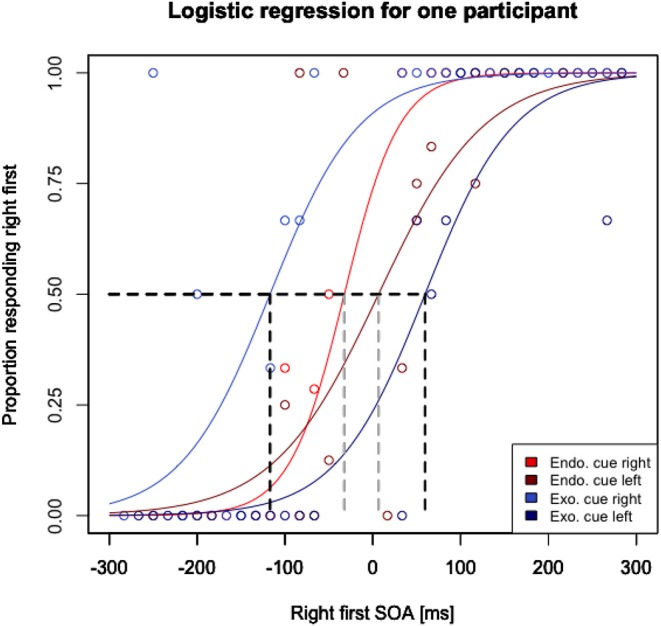
Figure 4.

Proportion responding right first as a logistic regression of stimulus onset asynchrony (SOA) for one participant as an example. PSS measurements were taken for the endogenous right cued items (red), endogenous left cued items (dark red), exogenous right cued items (blue), and exogenous left cued items (dark blue) for the SOAs corresponding to 0.50 proportion (see gray segments for endogenous cued items and black segments for exogenous cued items). Notable is the larger gap between right cued items and left cued items for exogenous trials compared to endogenous (reflecting larger distraction by peripheral cues).
