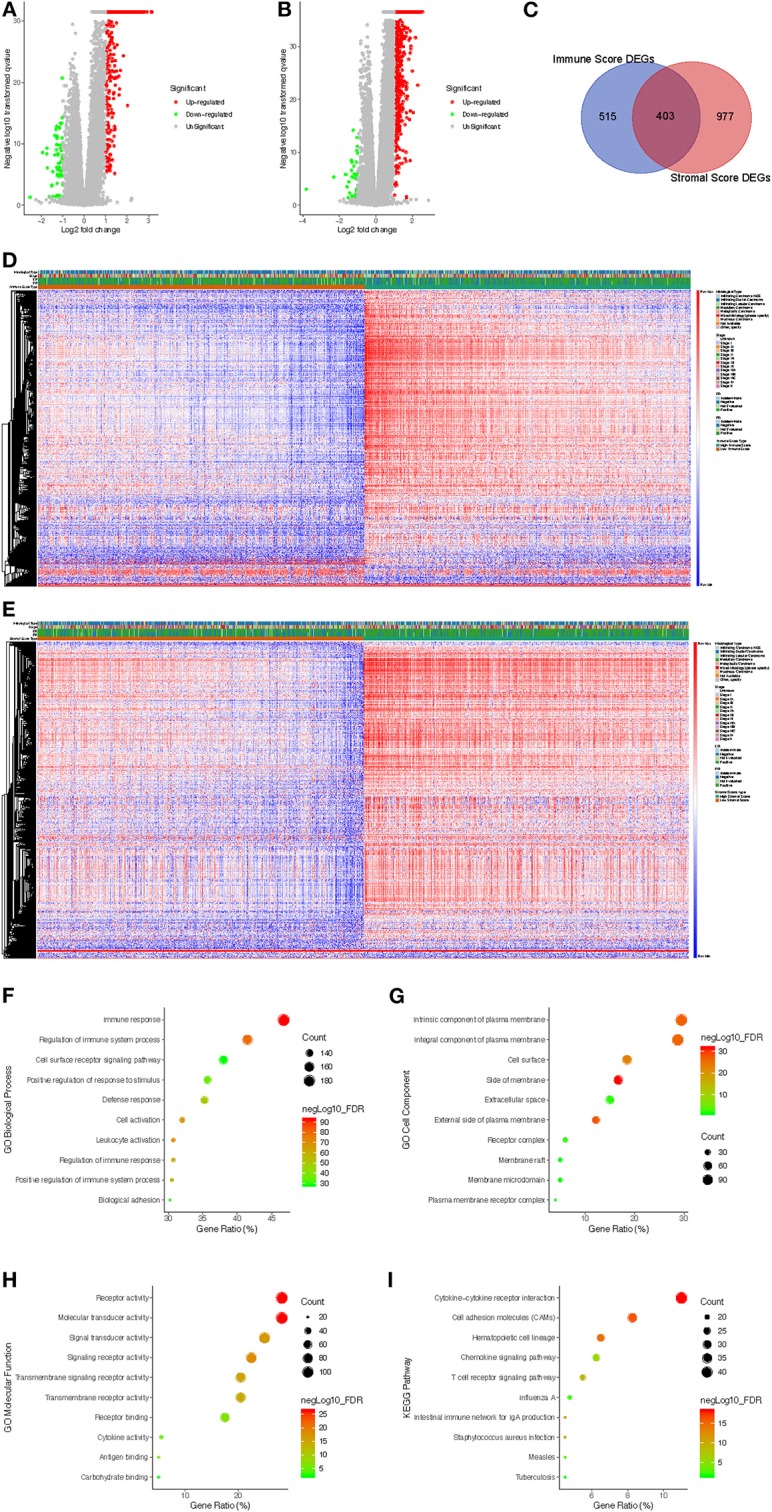
Figure 2.

Comparison of gene expression profiles with immune scores and stromal scores in breast cancer. (A) The significantly upregulated and downregulated genes in the high immune score group compared with the low score group are shown in the volcano plot (fold change > 2.0, p < 0.05). (B) The significantly upregulated and downregulated genes in the high stromal score group compared with the low score group are shown in the volcano plots (fold change > 2.0, p < 0.05). (C) Venn diagrams showing the commonly upregulated genes in both the high immune score group and high stromal score group. (D) Immune score DEGs in breast cancer displayed in a heat map. (E) Stromal score DEGs in breast cancer displayed in a heat map. (F–H) GO analysis results showing that commonly upregulated DEGs were particularly enriched in BP (F), CC (G), and MF (H). (I) The significantly enriched pathways of the commonly upregulated DEGs determined by KEGG analysis. GO, gene ontology; BP, biological process; CC, cell component; MF, molecular function; KEGG, Kyoto Encyclopedia of Genes and Genomes.
