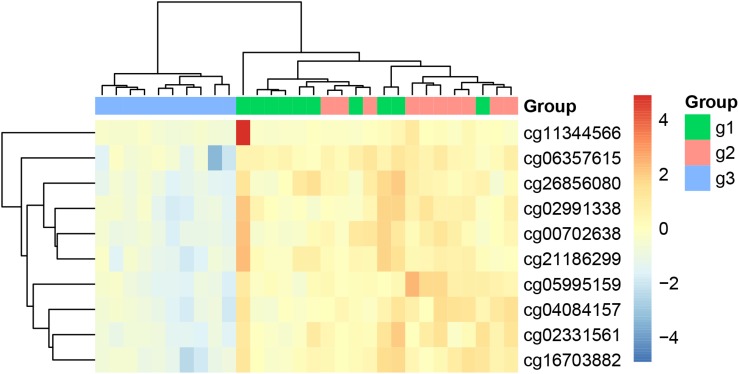
FIGURE 1.
The heatmap of the key methylation features. The 30 samples were from three groups: 10 patients with paroxymal atrial fibrillation (g1), 10 patients with persistent atrial fibrillation (g2), and 10 healthy individuals (g3). It can be seen that most samples were cluster into the right groups.

