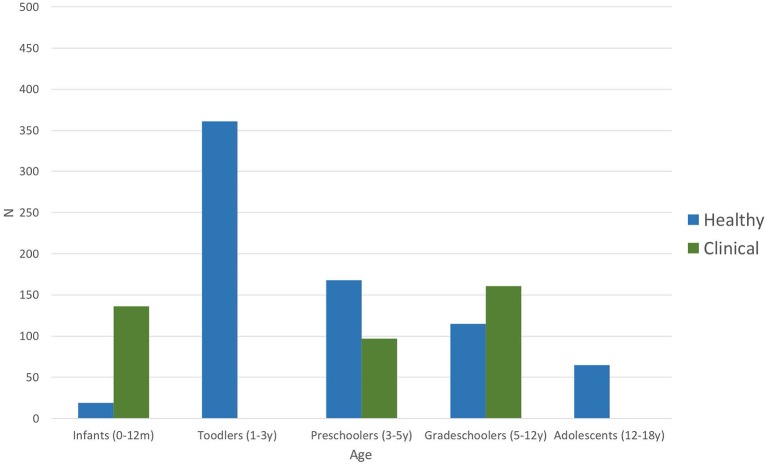
Figure 2.
Number of participants per age group of all included studies (n = 24). Blue bars represent number of participants included in the articles addressing healthy children; green bars stand for the number of participants included in studies investigating clinical populations (including control groups) such as autism spectrum disorder, dyslexia, language-learning impairment, or prematurity (Table 3).

