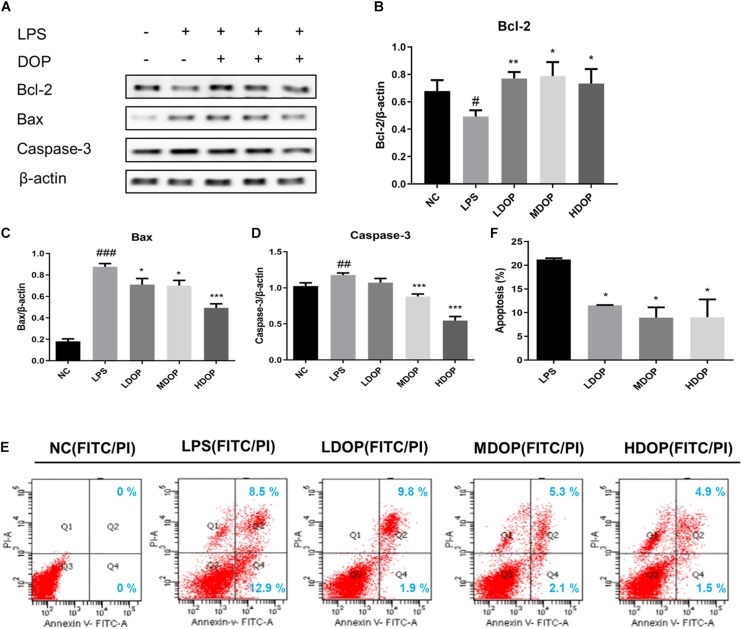
FIGURE 4.
DOP decreased Caco-2 cell apoptosis mediated by LPS. (A–D) The protein expression levels of Bcl-2, Bax, and caspase-3 in Caco-2 cells. (E) Contour diagram of the FITC-AnnexinV/PI flow cytometry of Caco-2 cells. (F) Calculation of apoptotic cells according to (D) Data are presented as the mean ± S.D. (n ≥ 3). #p < 0.05, ##p < 0.01, and ###p < 0.001 vs. NC. *p < 0.05, **p < 0.05, and ***p < 0.001 vs. FC.

