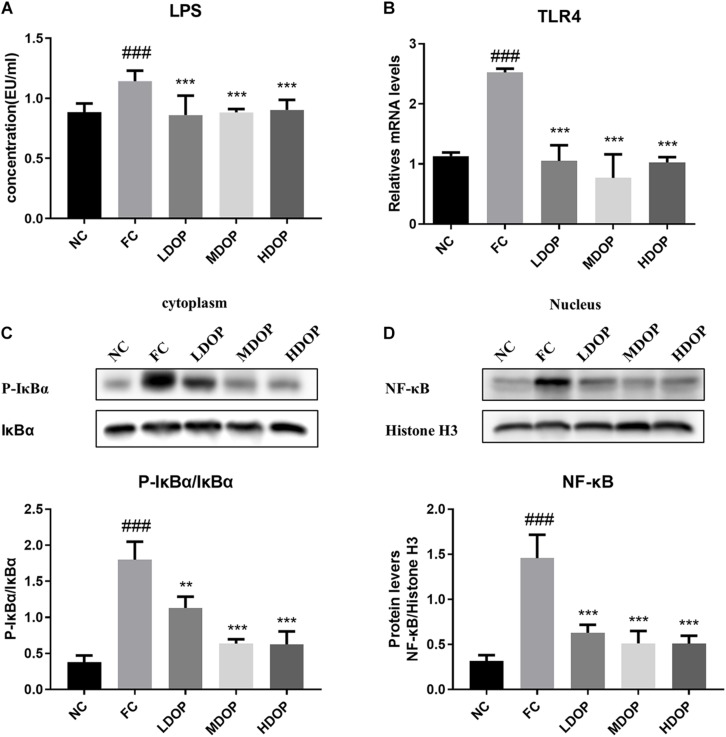
FIGURE 6.
DOP mitigated liver fibrosis through the LPS-TLR4-NF-κB pathway in the CCl4-induced liver fibrosis rat model. (A) Serum LPS levels. (B) TLR4 mRNA levels. p-IκBα and IκBα protein levels (C) in the liver cytoplasm and NF-κB protein levels (D) in the liver nucleus. Data are presented as the mean ± S.D. (n ≥ 8). ###p < 0.001 vs. NC. **p < 0.05, and ***p < 0.001 vs. FC.

