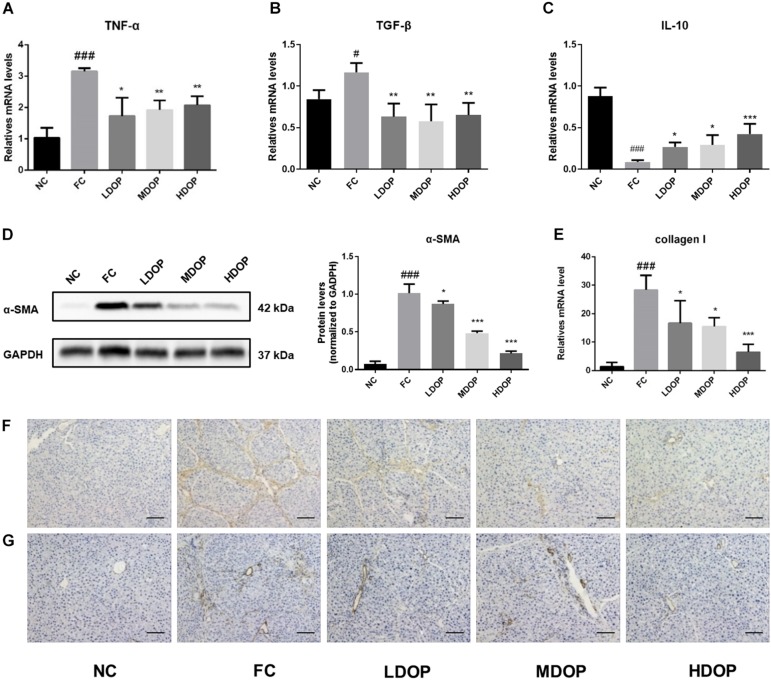
FIGURE 7.
DOP attenuated α-SMA and collagen I by modulating inflammatory cytokines in the CCl4-induced liver fibrosis rat model. (A–C) The mRNA levels of TNF-α, TGF-β, IL-10 in the liver. (D) The protein expression levels of α-SMA in the liver. (E) The mRNA levels of collagen I in the liver. (F–G) An immunohistochemical method was used to detect α-SMA (F) and collagen I (G). The images represented 2–3 different rats in each group (scale bar: 200 μm). Data are presented as the mean ± S.D. (n ≥ 3). #p < 0.05, ###p < 0.001 vs. NC. *p < 0.05, **p < 0.05, and ***p < 0.001 vs. FC.

