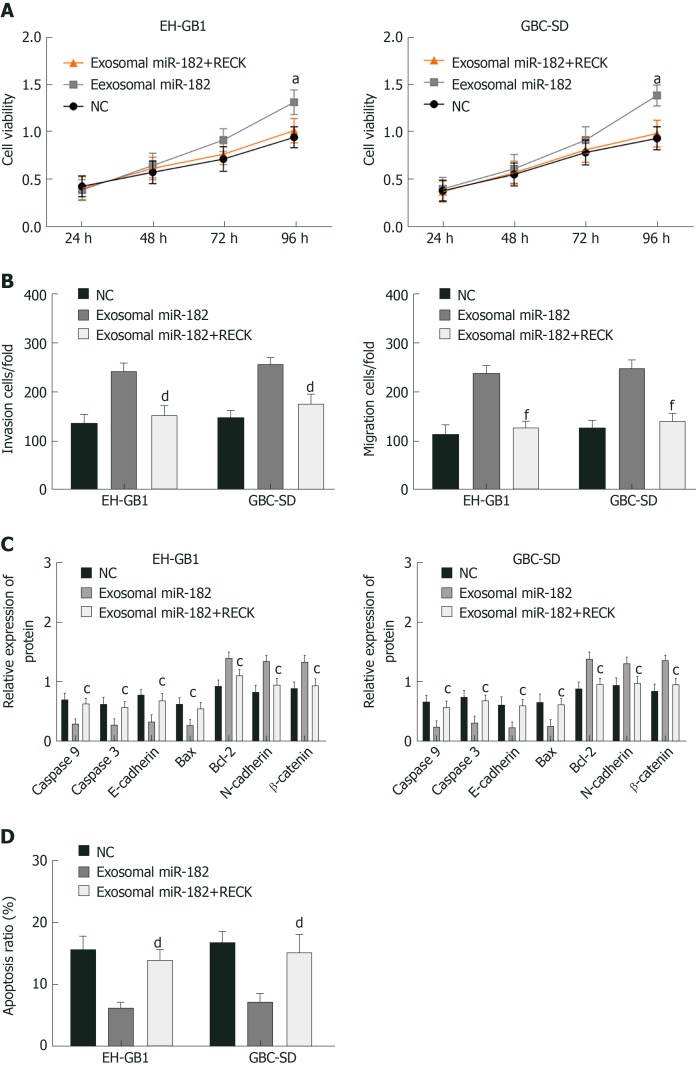
Figure 7.
Rescue experiment. A: Viability comparison of gallbladder cancer cells in each group; B: Comparison of cell invasion in each group; C: Comparison of EH-GB1 cell-related proteins in each group; D: Comparison of apoptosis in each group. aP < 0.05 vs the negative control (NC) group. cP < 0.05, dP < 0.01, and fP < 0.001 vs exosomal microRNA 182 group.

