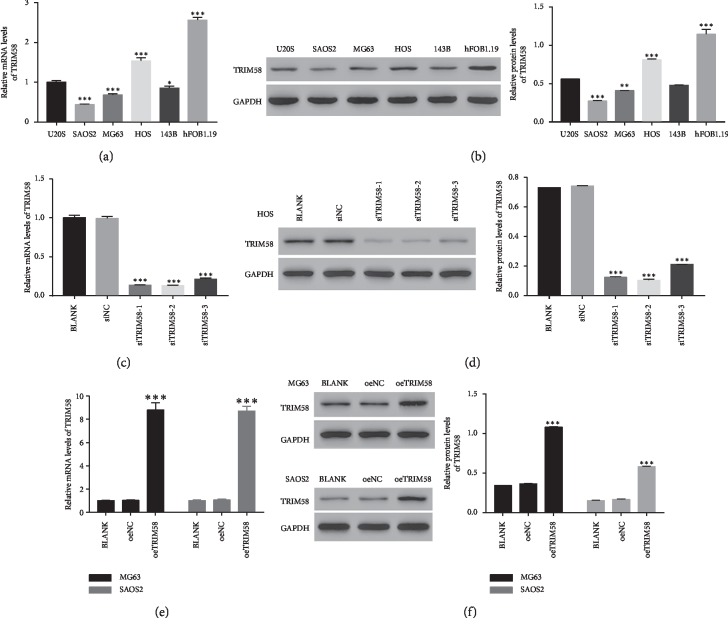
Figure 2.
Knockdown and overexpression of TRIM58 in OS cells. (a, b) The relative mRNA and protein levels of TRIM58 in different OS cells (U2OS, SAOS2, MG63, HOS, and 143B) and normal osteoblastic cells (hFob1.19). ∗p < 0.05 vs. U2OS; ∗∗p < 0.01 vs. U2OS; ∗∗∗p < 0.001 vs. U2OS. (c, d) The relative mRNA and protein levels of TRIM58 in siTRIM58-transfected cells. ∗∗∗p < 0.001 vs. BLANK. (e, f) The relative mRNA and protein levels of TRIM58 in oeTRIM58-transfected cells. ∗∗∗p < 0.001 vs. BLANK.

