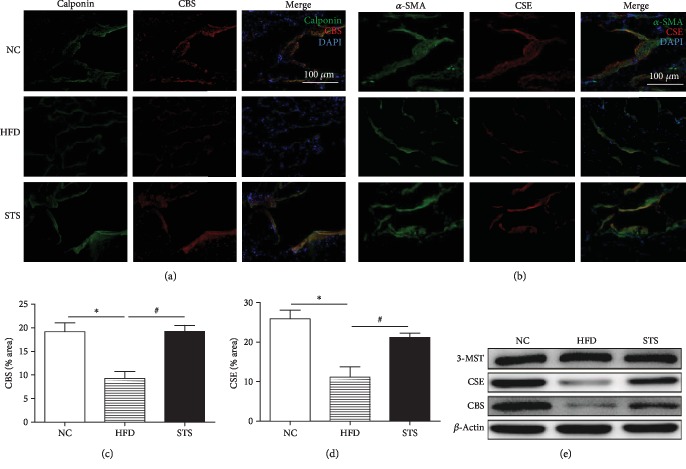
Figure 4.
Expression of CBS and CSE in the penile cavernous tissue. (a, b) Immunofluorescence staining for CBS and CSE in penile corpus cavernous tissue in each group. (c, d) Comparison of CBS and CSE expression in different groups. (e) Western blot analysis for CSE, CBS, and 3-MST. Each bar represents mean ± SEM; N = 12 rats per group. ∗P < 0.05 compared to the NC group; #P < 0.05 compared with the HFD group.

