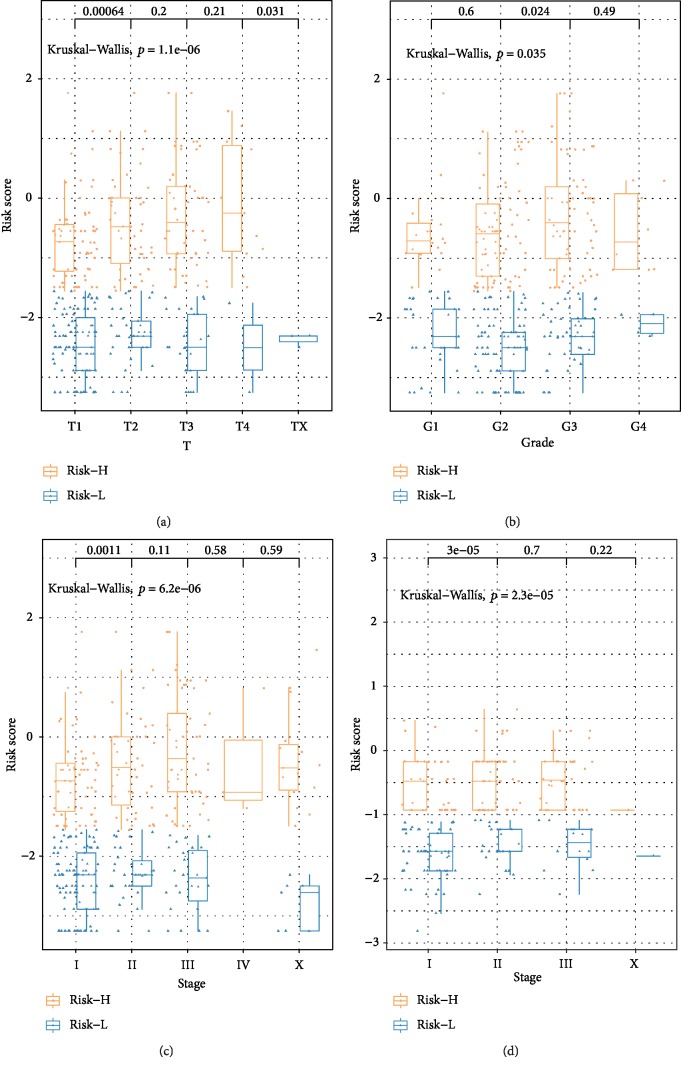
Figure 4.
Association between clinical features (T, stage, and grade) and risk score based on the nine-IRGP signature. Distribution of risk scores in (a) T, (b) grade, and (c) stage for TCGA data set. (d) Distribution of risk scores in stage for GSE14520 data set.

