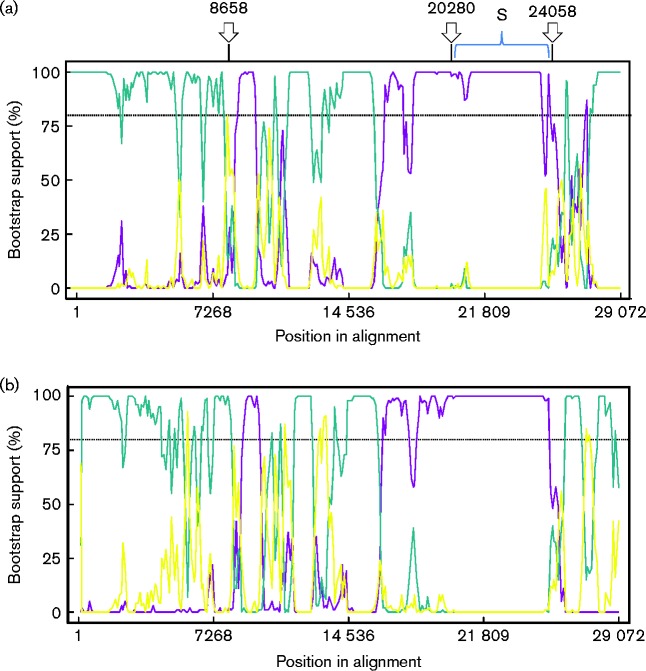
Fig. 3.
Bootscan analysis of the full-length genomic sequences of Fr TCoV, GfCoV/Fr/2011, US TCoV (TX-GL) and IBV (Italy 2005). In SimPlots (a) and (b) the query sequences are Fr TcoV and GfCoV respectively. Arrows above SimPlot (a) indicate putative breakpoints, which were predicted from analysis using the 69 full-length sequences. In (a) the yellow line corresponds to FN430414_ITA_90254_2005 – Turkey_GQ427174_TCoV_TX-GL_01; blue, FN430414_ITA_90254_2005 – Fr-TCoV-080385d_; purple, Turkey_GQ427174_TCoV_TX – GL_01 -Fr-TCoV-080385d_. In (b) the yellow line corresponds to FN430414_ITA_90254_2005 – Turkey_GQ427174_TCoV_TX-GL_01; blue, FN430414_ITA_90254_2005 – GfCoV/FR/2011_; purple, Turkey_GQ427174_TCoV_TX – GL_01 -GfCoV/FR/2011_. The dotted lines show bootstrap cut-offs of 80 %. Very similar plots were observed for FrTCoV and GfCoV in that both viruses were grouped with Italy 2005 for the majority of the sequences leading up to the S gene and after the S gene to the end of the genome.

