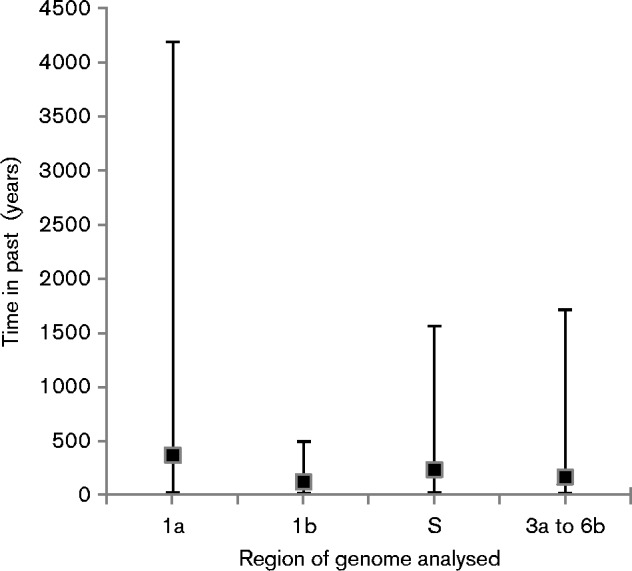
Fig. 4.

TMRCA analysis for different regions of the Fr TCoV and Gf CoV/Fr/2011 genomes. Black squares represent median values, and bars 95 % HPD intervals. Zero on the y-axis indicates the year when the most recent virus was isolated.

TMRCA analysis for different regions of the Fr TCoV and Gf CoV/Fr/2011 genomes. Black squares represent median values, and bars 95 % HPD intervals. Zero on the y-axis indicates the year when the most recent virus was isolated.