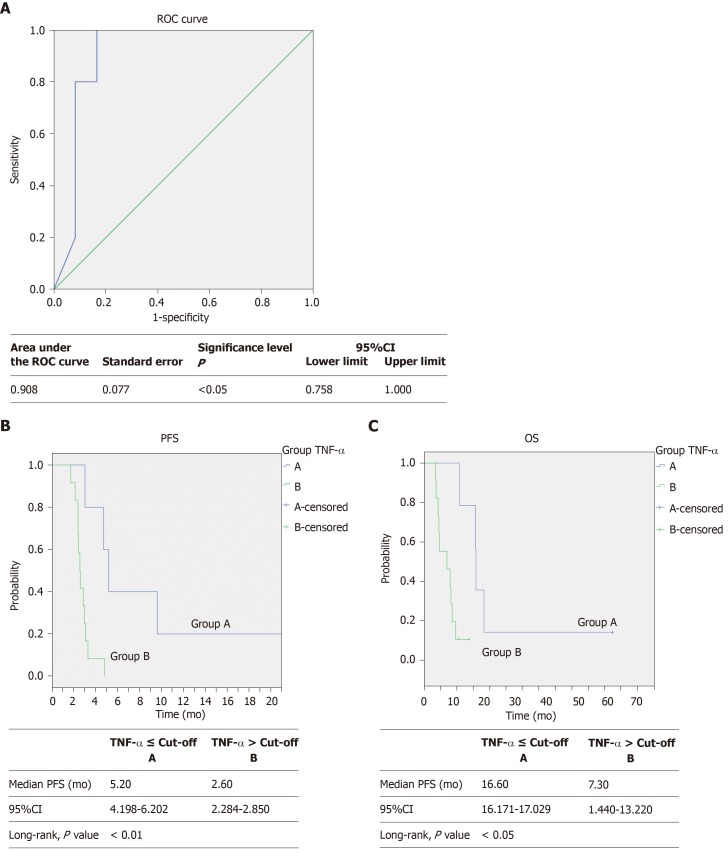
Figure 3.
Receiver operating characteristic curve analysis, progression free survival and overall survival Kaplan-Meier curves. A: Receiver operating characteristic curve with area under the curve (0.908, 95CI: 0.758–1.000, P = 0.010) for predicting survival by plasma TNF-α basal levels in patients with metastatic colorectal cancer treated with regorafenib according to the baseline TNF-α levels ≤ (―, n = 5) or > (―, n = 12) the cut-off value (determined by receiver operating characteristic curve analysis); B: Progression free survival (5.2 vs 2.6 mo, Log-rank test, P = 0.005); one patient in Group A is not shown because of a graphic choice; C: Overall survival (16.6 vs 7.3 mo, Log-rank test, P = 0.010). PFS: Progression free survival; OS: Overall survival; ROC: Receiver operating characteristic; TNF-α: Tumor necrosis alpha; TGF-β: Transforming growth factor alpha.

