
8.
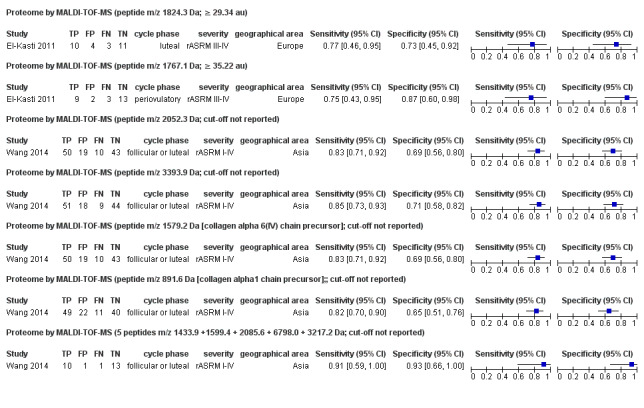
Forest plot of proteome for detection of endometriosis. Plot shows study‐specific estimates of sensitivity and specificity (squares) with 95% CI (black line), country in which the study was conducted, menstrual cycle phase at which the test was performed and severity of the disease assessed by each study, reported as rASRM stage. FN: false negative; FP: false positive; TN: true negative; TP: true positive.