2.

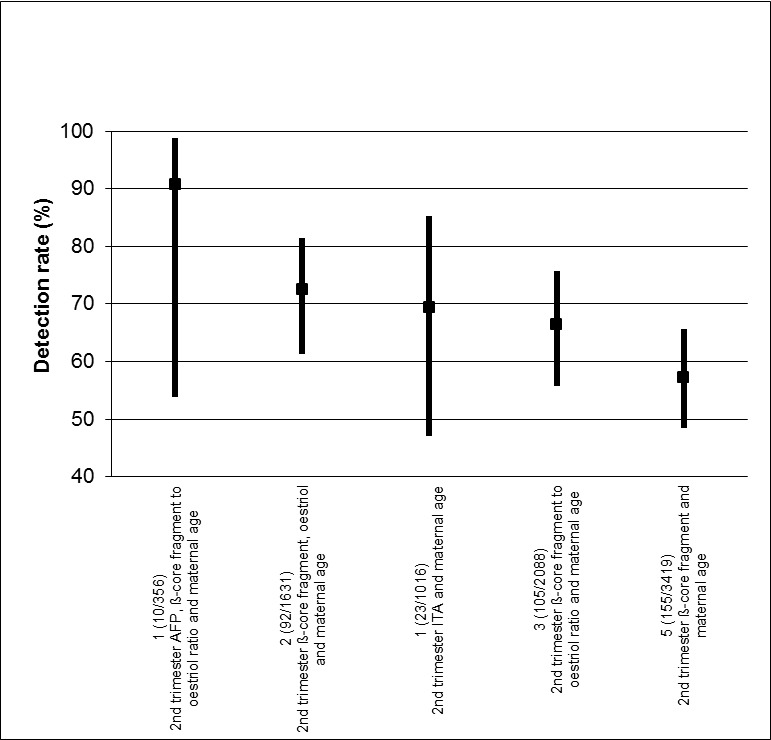
Detection rates (% sensitivity) at a 5% false positive rate for the five most evaluated or best performing test strategies. The estimates are shown with 95% confidence intervals. The test strategies are ordered on the plot according to decreasing detection rate. The number of studies, cases and women included for each test strategy are shown on the horizontal axis.
