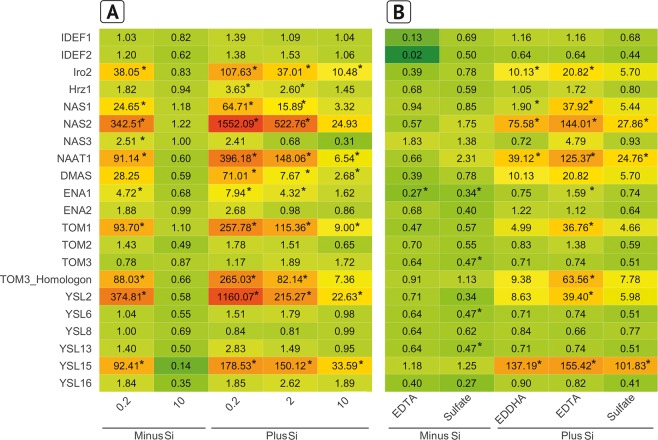
Figure 6.
Regulation of Fe homeostasis-related genes in rice roots as affected by Fe concentration and Fe form grown without Si and with Si (3 and 30 mg Si L−1, respectively) in nutrient solution. The 2−∆∆Ct values against the control are shown. (A) Gene expression in roots of rice plants grown with FeEDDHA in various concentrations (control = −Si, 2 mg L−1 Fe). (B) Gene expression in roots of rice plants grown with 2 mg Fe in the form of FeEDDHA, FeEDTA and Fe(II)SO4 (control = −Si, FeEDDHA). A star indicates significant differences against the control. Green color indicates downregulation and a red color upregulation compared to the WT grown without Si at optimal Fe conditions (2 mg L−1 FeEDDHA).

