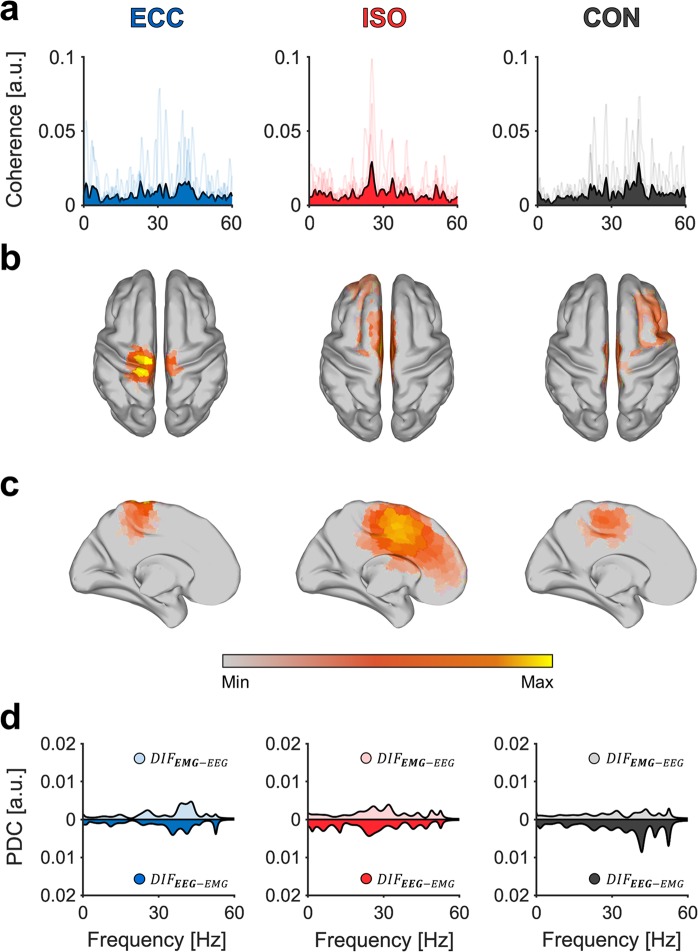
Figure 2.
Exemplary spectral maps of CMC, PDC and source localization for TAr. Results are organized in columns representing all three movement periods during BpS. Grand-averaged (A) CMC spectra with individual CMC spectra indicated through transparent lines. Grand-averaged source-localization results across all movement periods displayed in (B) dorsal view and (C) mid-sagittal view and (D) PDC spectra during BpS execution for all movement periods. Here, PDC in EEG-EMG direction is indicated through solid areas, whereas EMG-EEG direction is indicated through transparent areas of the same color. We used the MATLAB toolbox METH by Guido Nolte (https://www.uke.de/english/departments-institutes/institutes/neurophysiology-and-pathophysiology/research/research-groups/index.html) to illustrate source localization results in sections (B) and (C).

