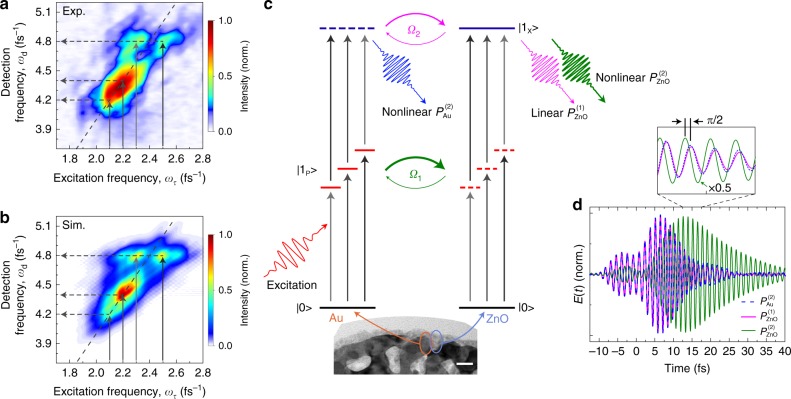
Fig. 4. Two-dimensional spectra reveal quantum pathways of nonlinear plasmon-exciton coupling.
a Fourier transformed fundamental band of the IFRAC trace in Fig. 3b, correlating fundamental excitation (vertical arrows) to nonlinear emission signals (horizontal arrows). The signal is symmetric with respect to the diagonal line with a slope of 2, indicating a second-order nonlinear process. The split signal at the exciton frequency shows that the excitonic emission is SF generated () with two fundamental modes at ∼ 2.3 fs−1 and ∼ 2.5 fs−1. The nonlinear plasmonic emission signal at the diagonal line corresponds to second-harmonic generation (). b Simulated fundamental band using a nonlinear plasmon–exciton coupling model, reproducing well the features of the experiment. c Schematic illustration of nonlinear plasmon–exciton coupling. Few-cycle pulses excite several plasmonic hot spot modes |1P> with distinct resonance frequencies at the surface of the hybrid nanosponge (bottom inset: transmission electron microscopy image, scale bar: 20 nm), generating a nonlinear plasmonic polarization . In second-order coupling (Ω2), are coherently Rayleigh scattered by the ZnO inclusion, giving a linear polarization . In first-order coupling (Ω1), the locally enhanced plasmonic fields drive the second-order nonlinear polarization of the ZnO exciton |1X>. In all quantum pathways, the nonlinear fields can be generated via either second-harmonic or SF channels (marked by gray arrows with their lengths representing different energies). d Simulated electric fields of the three emission pathways for a coupled hot spot–exciton system from a single plasmonic hot spot at = 2.5 fs−1. After scaling, is almost identical and in-phase with . In contrast, is phase-shifted by about −π/2 and prolonged in time with respect to .

