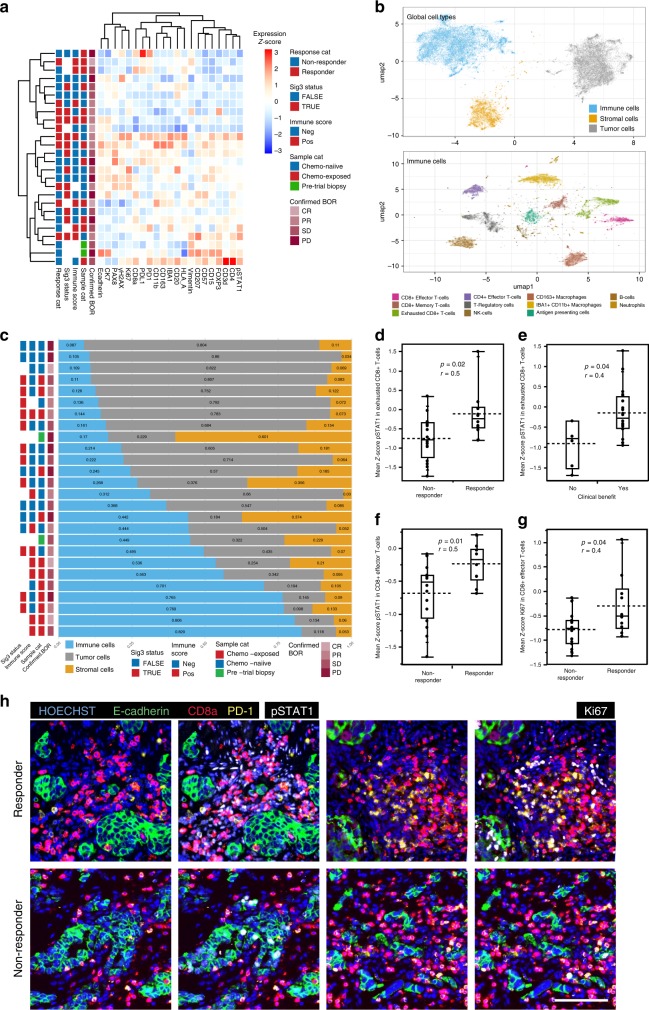
Fig. 3. Interferon activation and proliferative state of CD8 + T-cells associate with response.
a A hierarchical clustering heatmap of the mean expression levels of single-cell quantification using tCycIF and annotated with Sig3 status, Nanostring Immune score, sample category (Sample cat), and confirmed best objective response (confirmed BOR) in 26 patients. b Cell-type calls visualized using semi-supervised UMAP dimensionality reduction reveals the clustering of tumor-stroma immune (upper panel), and the tumor microenvironment immune cell subpopulations (lower panel) into distinct clusters. c Chemo-exposed samples had a higher immune- and stromal infiltration in the tumor microenvironment. The proportions of immune (blue), tumor (gray) and stromal (yellow) cells of the 26 samples (rows) analyzed via single-cell imaging. d Mean pSTAT1 protein expression in exhausted CD8 + T-cells was higher in responders (n = 10) compared to non-responders (n = 16) and e in patients with clinical benefit (n = 20) compared to patients with no clinical benefit (n = 6). f pSTAT1 expression and g Ki67 levels in effector CD8 + T-cells associated with response. p < 0.05 was considered significant, r; effect size, Mann–Whitney U-test, all test were two-sided. h We observed increased pSTAT1 and Ki67 expression in the exhausted and effector CD8 + T-cells in the responders (upper row) compared to non-responders (lower row). Scale bar 50 µm. Box plots are presented as the range (whiskers), center line as the median, bounds of box mark the highest and lowest quartiles, and the dashed line represents the mean.

