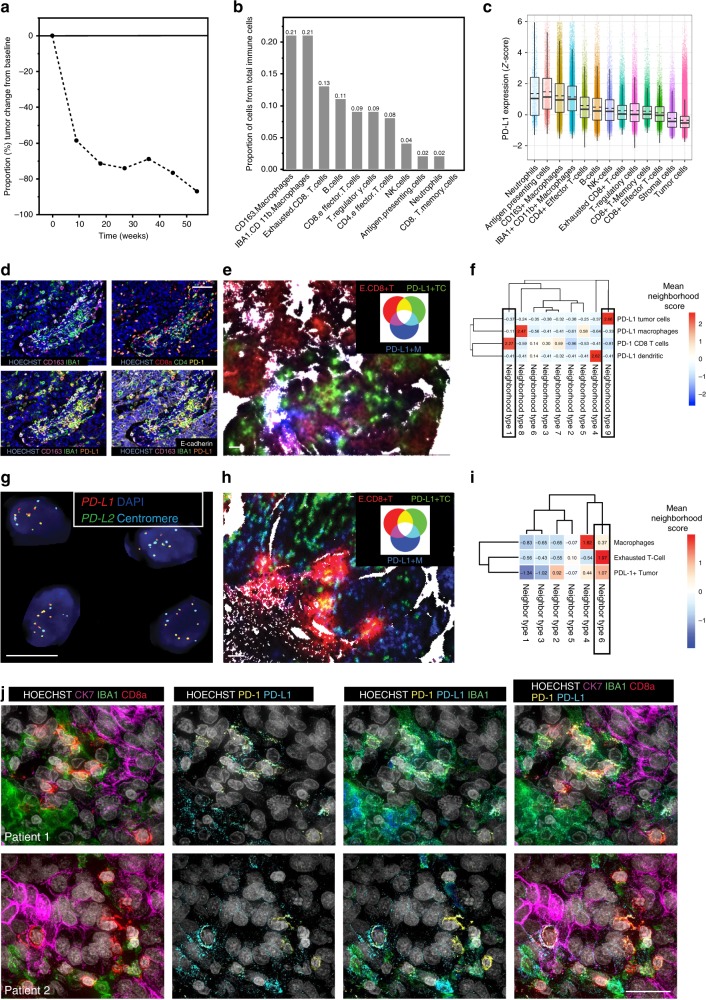
Fig. 4. Two extreme responders show differential spatial patterns of cellular interactions in the tumor microenvironment.
a The graph showing the percentage of tumor regression from baseline over time (weeks) in the first extreme responder; she achieved a PR lasting over 10 months with 87% tumor regression from the baseline. b The proportion of immune cell subpopulations out of total immune cells in the tumor microenvironment. The patient’s tumors immune infiltration was enriched in macrophages and exhausted CD8 + T-cells. c The normalized (z-score) PD-L1 expression according to the tumor microenvironment cell subpopulations. The highest PD-L1 expression was observed in CD163 + IBA1 + CD11b + Macrophages. Individual dots represent single cells. Box plots are presented as the range (whiskers), center line as the median, bounds of box mark the highest and lowest quartiles, and the dashed line represents the mean. d Multiplexed immunofluorescent images confirmed the high infiltration of macrophages and PD-1 positive exhausted CD8 + T-cells (higher row), and the high expression of PD-L1 in the macrophages (lower row). Scale bar 50 µm. e Spatial visualization of neighborhood (k = 10) composition shows increased interaction between PD-1+ exhausted CD8 + T (E.CD8 + T)-cells and PD-L1-positive macrophages (PD-L1 + M) shown in magenta, compared to PD-L1-positive tumor cells (PD-L1 + T) Scale bar 50 µm. f K-means clustering indicated that neighborhood clusters containing PD-1+ exhausted CD8 + T-cells contain PD-L1 + macrophages and not PD-L1-positive tumor cells. g The second extreme responder exhibits PD-L1 and PD-L2 amplification confirmed by FISH. Scale bar 10 µm. h Spatial visualization of neighborhood (k = 10) composition shows increased interaction between PD-1+ exhausted CD8 + T (E.CD8 + T)-cells and PD-L1-positive tumor cells (PD-L1 + T) shown in yellow, compared to PD-L1-positive macrophages (PD-L1 + M). Scale bar 50 µm. i K-means clustering indicated that neighborhoods containing most of the PD-1+ exhausted CD8 + T-cells cluster together with the PD-L1 + tumor cells and less with the PD-L1-positive macrophages. j High-resolution imaging of the two extreme responders using cyclic immunofluorescence. First row depicts the first patient, with exhausted CD8 + T-cells, tumor cells and macrophages in the tumor microenvironment (first column), with positive PD-L1 expression (second column) in the IBA1 + macrophages, most of which were also positive for CD163 (third column), and co-localization of the exhausted CD8 + T-cells with the PD-L1-positive macrophages (fourth column). In the second patient (second row), the exhausted CD8 + T-cells were spatially more next to the tumor cells (first column), while there was clear staining of PD-L1 also in the tumor cell compartment (second column, arrows), in addition to the macrophages (third column), and PD-1/PD-L1 the exhausted CD8 + T-cells. Scale bar 20 µm.

