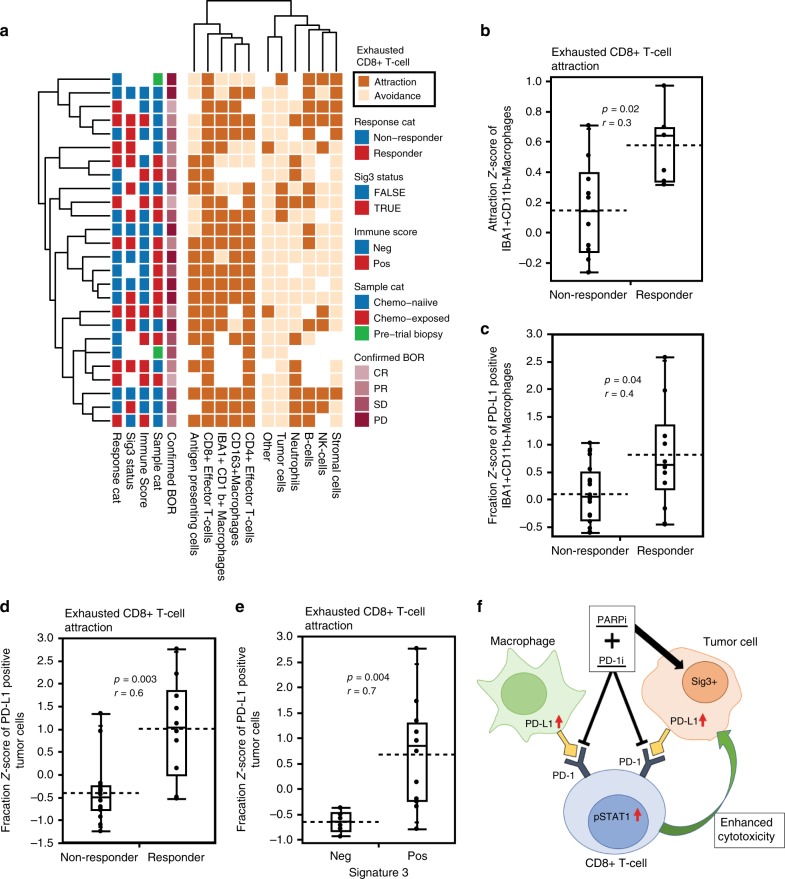
Fig. 5. Spatial interactions of exhausted CD8 + T-cells associate with response and mutational signature 3.
a A hierarchical clustering of significant interactions of other cell types towards exhausted CD8 + T-cells from neighborhood analysis using permutation test; positive fold-change being attraction and a negative as avoidance, with a two-sided test and a cutoff of p < 0.05. b In the 16 tumors with significant attraction, of IBA + CD11b + Macrophages towards exhausted CD8 + T-cells the attraction score was higher in the responders (n = 6) compared to non-responders (n = 10). The responders (n = 10) had a significantly higher fraction (z-score) of PD-L1-positive macrophages (c) and tumor cells (d) interacting with exhausted CD8 + T-cells compared to non-responders (n = 16). e The fraction (z-score) of PD-L1-positive tumor cells neighboring exhausted CD8 + T-cells was higher in the Sig3 + (n = 12) compared to Sig3– (n = 6) tumors. p < 0.05 was considered significant, r; effect size, Mann–Whitney U-test. f The model summarizing the findings in the present study. The responses to the combination of niraparib and pembrolizumab are determined by tumor mutational signature 3-positivity, associated with increased PD-L1 positivity in the macrophages and tumor cells, the interferon-primed exhausted CD8 + T-cells and activated effector CD8 + T-cells, and their spatial interactions in the tumor microenvironment. Box plots are presented as the range (whiskers), center line as the median, bounds of box mark the highest and lowest quartiles, and the dashed line represents the mean.

