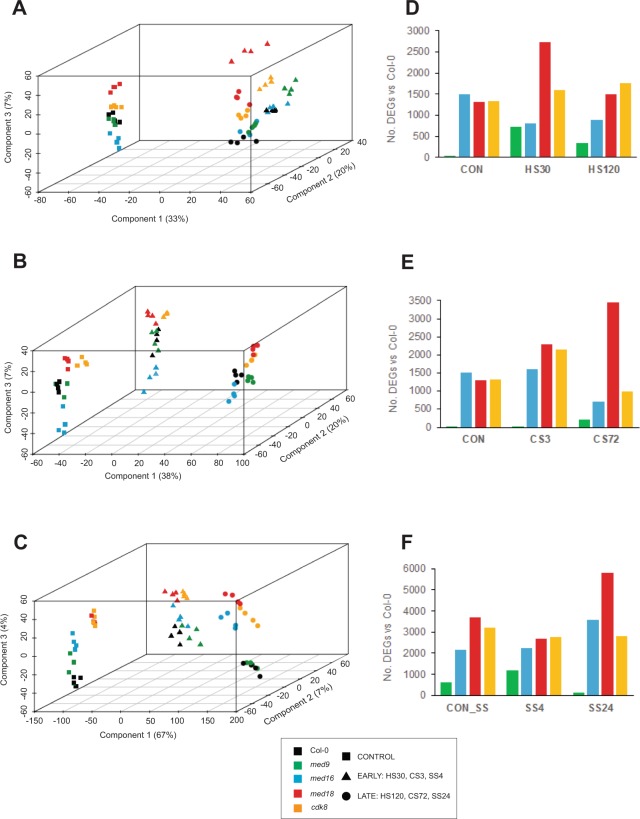
Figure 2.
Global comparison of Arabidopsis Col-0 and Mediator mutant transcriptomes in control and abiotic stress conditions. Each data point represents the entire transcriptome for each sample, and are arranged in the first, second and third dimensions according to the components of a principal component analysis (PCA; shown on the x, z and y axes, respectively). Each transcriptome from the (A) heat, (B) cold and (C) salt stress experiments is shown as one data point. Transcriptomes from plants in control conditions are shown as squares; those from early stress time-points (HS30, CS3 and SS4) are shown as triangles; and those from late time-points (HS120, CS72 and SS24) are shown as circles. Col-0 wild type: black; med9: green; med16: cyan; med18: red; cdk8: orange. The contribution of each component to the total variation between samples is shown as a percentage. (D-F) Total numbers of significant differentially expressed genes (DEGs; padj ≤ 0.01 and log2 fold-change ≥ ± 0.5) between Col-0 and Mediator mutant transcriptomes in each stress.

