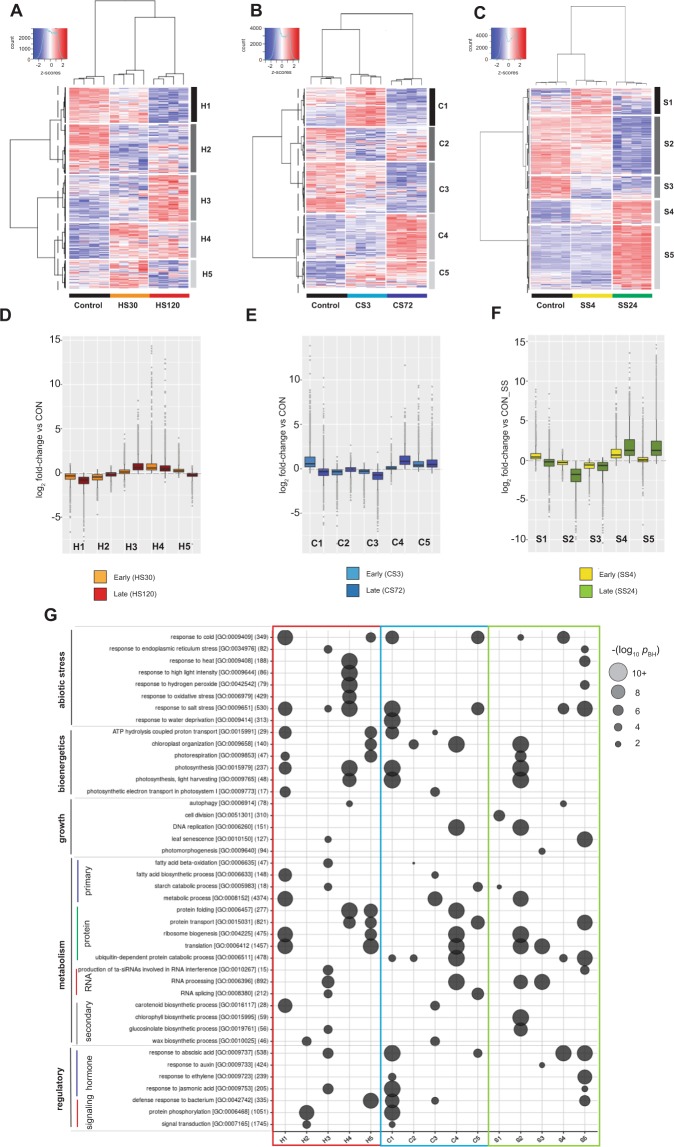
Figure 3.
The transcriptional response of Arabidopsis Col-0 plants to abiotic stress. The transcriptional response of Col-0 wild type to (A,D) heat, (B,E) cold or (C,F) salt stress is shown. (A–C) Hierarchical clustering of co-expressed genes, differentially regulated in response to (A) heat-, (B) cold-or (C) salt stress, either in control conditions or early or late phase of stress. VST-normalised data for around 15,000 filtered transcripts are displayed as z-scores, and cluster dendrograms are shown with a dashed line indicating divisions between 5 co-expressed clusters (H1-5, C1-5 or S1-5 for heat clusters 1–5, cold clusters 1–5, or salt clusters 1–5, respectively). (D–F) Summary boxplots indicating log2 fold-change (relative to expression in Control conditions) for all transcripts in each of the 5 co-expressed gene clusters in (D) heat, (E) cold or (F) salt stress. Boxes indicate the first quartile, the median, and the third quartile. The whiskers indicate the range of no more than 1.5 times the interquartile, and outliers are individually marked. Fold-change data from both the early and late stress time-points in each experiment are shown. (G) Gene ontology (GO) enrichment analysis of each co-expressed cluster in stress experiments. The size of the circle and colour intensity indicates the significance (–log p-value (Benjamini-Hochberg adjusted)) of the functional enrichment for each category. The total number of genes from each GO category in Arabidopsis thaliana, which were present in our detected population, is shown in parentheses after their GO consortium IDs. Some functional redundant functional categories were excluded for clarity.

