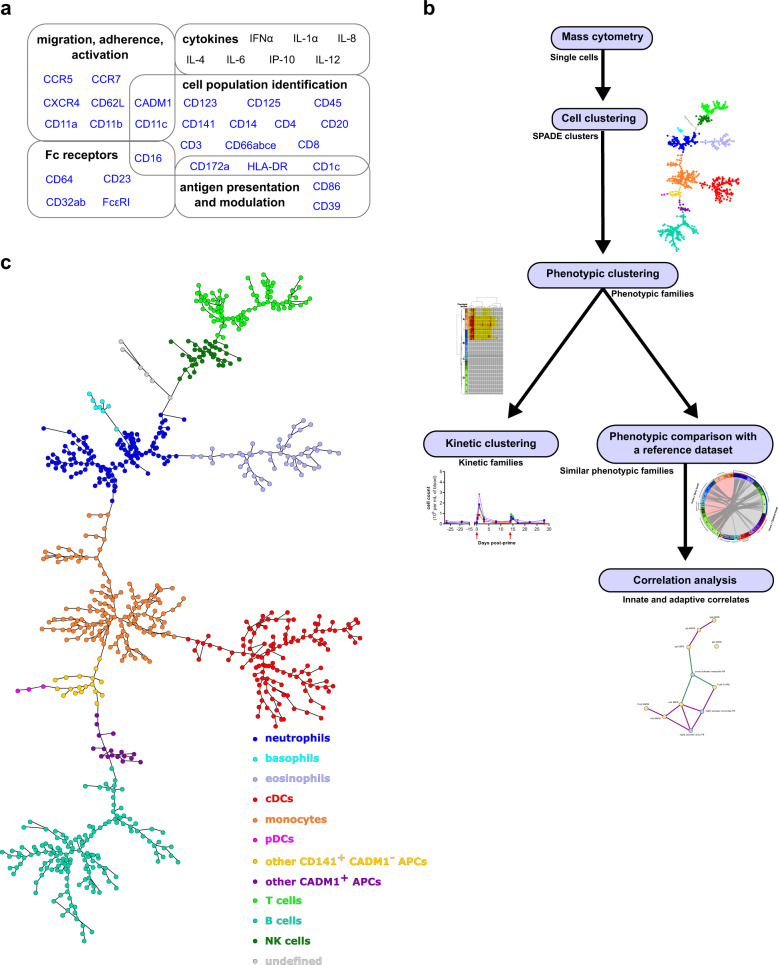
Fig. 3. Bioinformatics pipeline used for the analysis of high-dimensional cytometry profiles.
a A mass cytometry panel of 35 markers dedicated to the characterization of innate myeloid cells was used to stain fixed leukocytes obtained from cynomolgus macaque blood samples. Markers used for the SPADE clustering are indicated in blue. b The SPADE algorithm was used to identify groups of cells sharing similar phenotypes, called cell clusters. Phenotypic families, corresponding to groups of cell clusters with similar phenotypes, were defined for both the granulocyte and monocyte-DC compartments. Kinetic families, corresponding to phenotypic families sharing the same abundance profiles over time, were determined. Unsupervised phenotypic comparisons between the current shortened vaccine schedule study and a previously published longer vaccine schedule study15 were performed and correlations between innate myeloid responses and antibody responses were assessed. c The SPADE tree generated using all samples of the shortened vaccine schedule dataset and annotated based on the expression of 15 markers (Supplementary Fig. 3). Granulocyte clusters were defined as neutrophils (CD66+ CD125−), eosinophils (CD66+ CD125+), and basophils (CD66− CD123+ HLA-DR−). Monocyte-DC clusters were defined as monocytes (CD14+ HLA-DR+), cDCs (CD14− HLA-DR+ CD11c+ CD16+), inflammatory cDCs/nonclassical monocytes (CD14+ HLA-DR+ CD11c+ CD16+), pDCs (CD123+ HLA-DR+), other CADM1+ APCs (HLA-DR+ CD3− CD8− CD14− CD11c− CD16− CD20− CADM1+), and other CD141+ CADM1− APCs (HLA-DR+ CD3− CD8− CD14− CD11c− CD16− CD20− CD141+ CADM1−). Lymphocyte clusters were defined as B cells (CD20+ HLA-DR+), T cells (CD3+), and NK cells (CD3− CD8+). The undefined category corresponds to cell clusters that did not fit any of these phenotypes.

