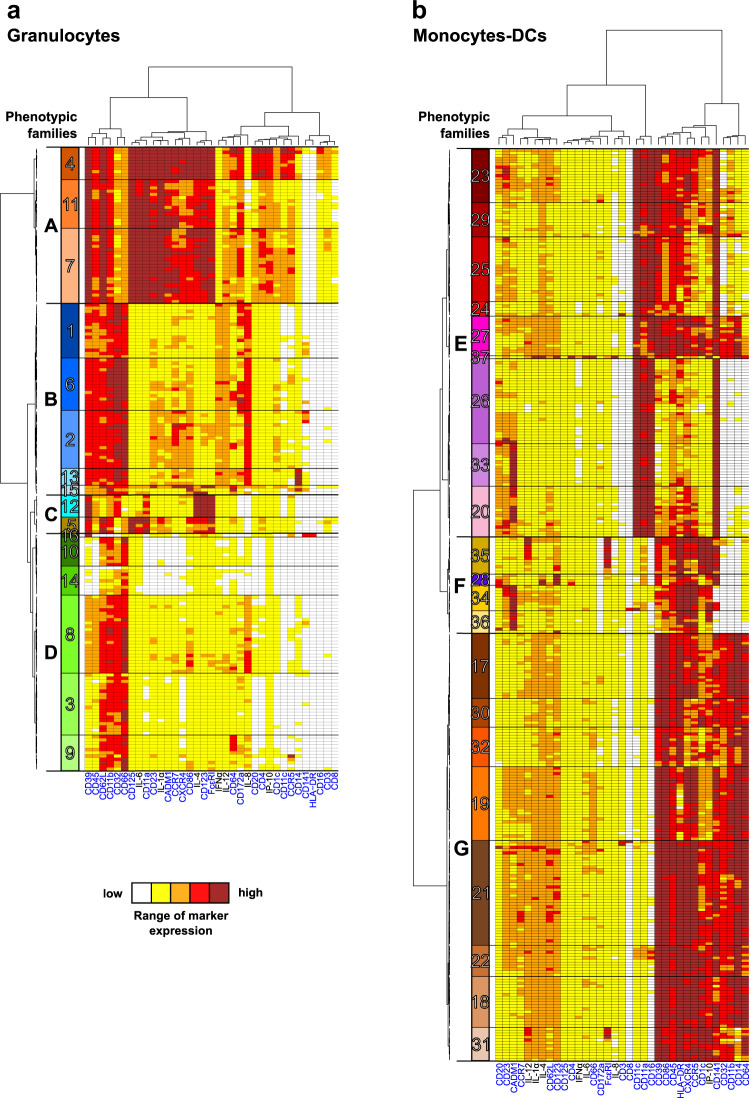
Fig. 4. Phenotypic diversity of granulocytes and monocytes-DCs in the shortened vaccine schedule dataset.
Categorical heatmaps showing relative marker expression for (a) granulocyte or (b) monocyte-DC clusters. Each row corresponds to a cell cluster, and each column corresponds to a cell marker. Phenotypic families, corresponding to groups of cell clusters sharing similar phenotypes, were delineated based on the cluster dendrogram. The 16 granulocyte phenotypic families (numbered from 1 to 16) and the 21 monocyte-DC phenotypic families (numbered from 17 to 37) are indicated in different colors. Black frames labeled with capital letters indicate superfamilies of phenotypic families. SPADE clustering markers are indicated in blue. Interactive heatmaps are available at http://data.idmitcenter.fr/MVA-innate-myeloid-early-boost/.

