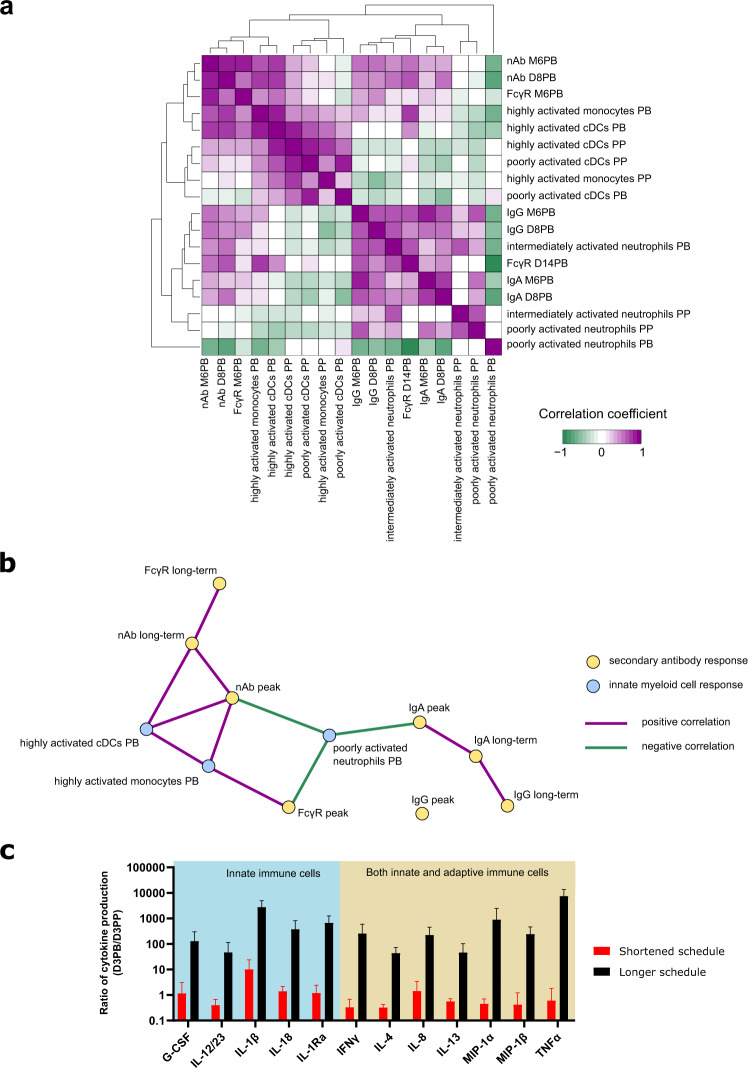
Fig. 7. Correlation between innate myeloid subphenotypes and humoral response and link between phenotype and function.
a, b The correlations between the peak (8 or 14 days post-boost, D8 or D14PB) and long-term persistence (6 months post-boost, M6PB) of the secondary antibody response and the innate myeloid cell response were assessed. a All associations are displayed after hierarchical clustering of the correlation coefficients with complete linkage. b All Ab response variables used for the correlation analysis are represented (in yellow), whereas only the innate myeloid response variables that correlated (|R| > 0.7, positive correlations in plum and negative correlations in green) with at least one Ab response variable (in blue) are displayed on the correlation graph. c The ex vivo cytokine production of unstimulated PBMCs was assessed 3 days post-prime (D3PP) and post-boost (D3PB) (both vaccine schedules). For each of the indicated cytokines, the ratio of cytokine level at D3PB to the level at D3PP is represented as the mean ± standard deviation for the five animals. The main immune cell producers are also indicated. Only cytokines with a statistically significant different ratio between the two schedules, with at least one ratio >10, are represented. Significance was considered to be p ≤ 0.01 by the Mann−Whitney−Wilcoxon test.

