
Figure 7.
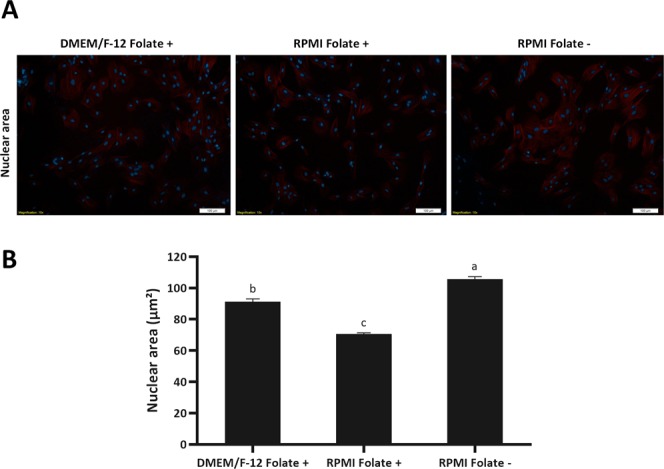
(A) The nuclear area of folate deprived cells was assessed by fluorescence microscopy after phalloidin-tetramethylrhodamine B isothiocyanate and Hoechst 33342 staining. Merged images of tubulin and DNA are shown. Scale bars represent 100 µm. (B) Using ImageJ software (National Institute of Mental Health, Bethesda, Maryland, USA) the nuclear area of 100 fibroblasts in 10 different fields was calculated. Values represent the mean ± SEM. Different letters indicate significant differences (P < 0.05).