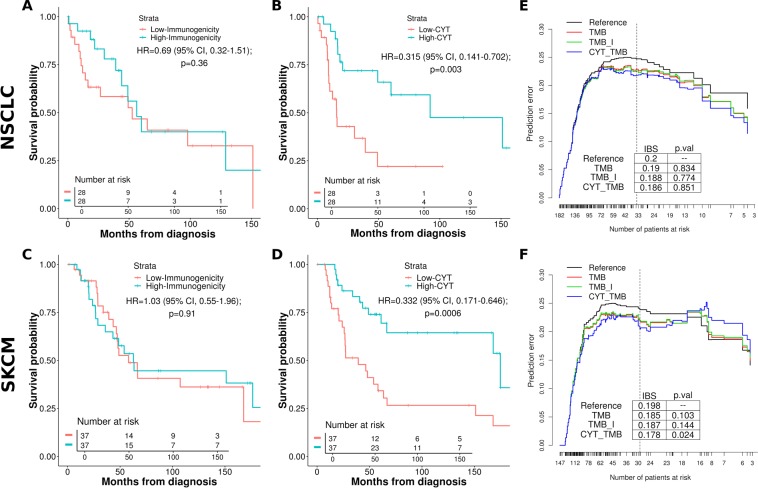
Figure 3.
Univariable KM survival curves between patients grouped by highest and lowest immunogenicity (Ϊ) and immune activity marker expression (CYT) scores for the (A,B) lung (NSCLC) and (C,D) melanoma (SKCM) TCGA cohorts. Quantiles of I and CYT patient scores used to group cohorts with the lowest and highest groups represented by the curves; (E,F) Time dependent Brier scores (prediction error curves) comparing multivariable cox proportional hazard survival models for the NSCLC cohort (E), and SKCM cohort (F). Reference is intercept, all other models include tumor stage covariates. TMB includes patient tumor mutation burden, TMB_I includes immunogenicity and TMB, CYT_TMB includes CYT and TMB. Vertical lines demarcate approximately 80% of the patients, for which integrated Brier scores were calculated.

