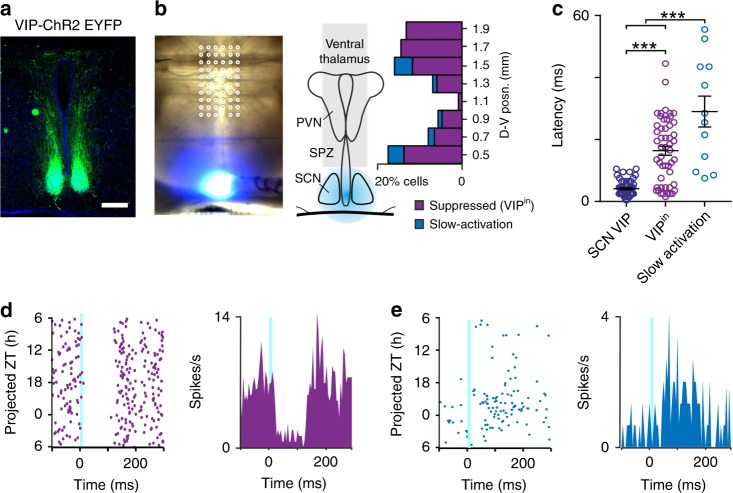
Fig. 2. Optogenetic identification of VIPin cells in regions receiving SCN input.
a Immunohistochemical amplification of ChR2-EYFP expression from a VIP-ChR2 mouse, showing terminal fields of the VIP neurons lying within the SPZ, PVN and ventral thalamus. b Light microscope images of a VIP-ChR2 brain slice on the pMEA with overlaid recording site locations (left) and schematic showing the percentage of identified cells displaying suppressions or slow-activation following 10 ms light flashes (right; n = 51 and 12 cells, respectively from 718 isolated neurons). c Response latencies for SCN VIP cells and SPZ, PVN and ventral thalamic cells exhibiting optogenetic-driven suppressions (VIPin) or slow-activation. Data analysed by multilevel mixed-effects linear model (F2,44.89 = 18.0, P < 0.001) with Tukey post-tests. d, e Flash evoked single unit spike rasters over 24 h (left) and mean response histograms (right) for representative cells showing optogenetic-driven suppression (d) or slow-activation (e).

