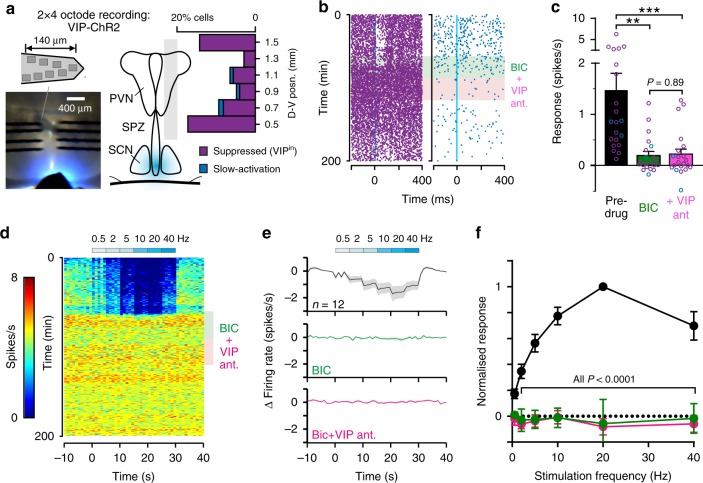
Fig. 4. Suprachiasmatic nucleus VIP neurons drive GABA-mediated responses in downstream target neurons.
a Slice image and schematics (left) illustrating 2 × 4 octode probe placement and position of fibre-optic delivered light flash. Right panel shows the percentage of identified cells displaying suppressions or slow-activation following 10 ms light flashes (in total n = 37 and 3 cells respectively from 561 isolated neurons), from ex vivo recordings across the SPZ, PVN and ventral thalamus of VIP-ChR2 mice. b Peri-event spike raster plots for representative VIPin (supressed) and cells with slow-activation prior-to and following BIC application and subsequent co-application with VIP antagonist. c Mean ± SEM optogenetically-evoked change in firing rate of individual cells prior to and following antagonist treatment (n = 18 VIPin and n = 3 cells with slow-activation). Data analysed by multilevel mixed-effects linear model (Treatment: F2,24.521 = 8.44, P = 0.002) with Tukey’s post-tests. d, e Pseudo-coloured spike raster for representative VIPin cell (d) and mean ± SEM baseline-subtracted firing rates across the population (e; n = 12 cells) during exposure to repeated stimulation (10 ms flashes) at varying frequencies, prior to and following antagonist treatment as above. f Mean ± SEM normalised change in firing (relative to no stimulation) for VIPin cells (n = 12) as a function of optogenetic stimulation frequency during pre-drug and antagonist treatment conditions. Data analysed by multilevel mixed-effects linear model (Frequency: F5,21.785 = 6.99, P < 0.001; Treatment: F2,20.357 = 49.72, P < 0.001; Interaction: F10,23.401 = 16.71, P < 0.001) with Sidak’s post-test. ***P < 0.001, **P < 0.01.

