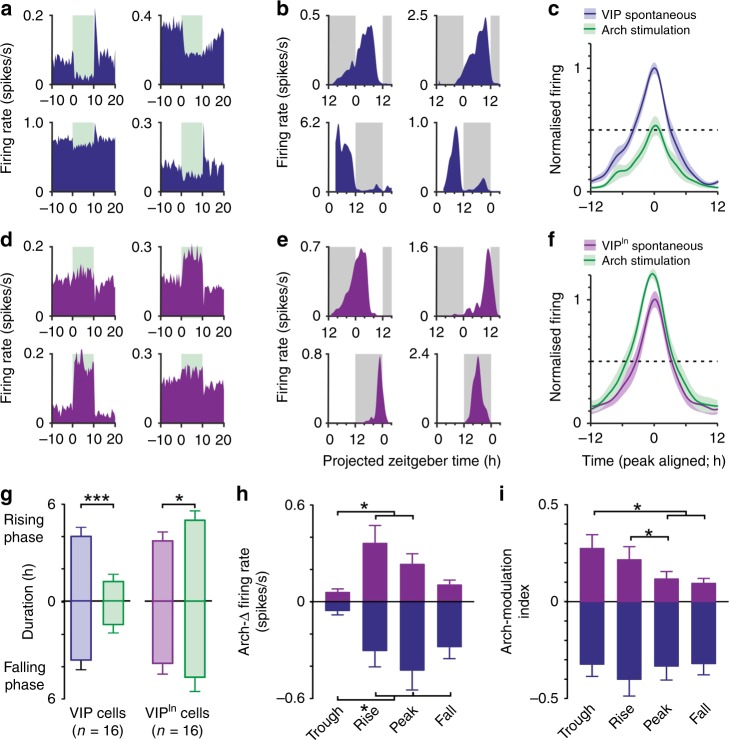
Fig. 5. Optogenetic inhibition of SCN VIP cells modulates daily variations in VIPin cell activity.
a, d Peri-event histograms for example SCN VIP (a) and extra-SCN VIPin (d) cells identified in pMEA recordings from VIP-Arch slices by 10s yellow light steps applied to the SCN region (565 nm, 140 mW/mm2 at fibre tip; means of ~300 trials). b, e Example spontaneous firing activity from optogenetically identified SCN VIP (b) and extra-SCN VIPin cells (e), from slices prepared during late (top panels) or early (bottom panels) projected day (traces correspond to units in a, d). c, f Mean ± SEM normalised, peak aligned, 24 h firing profiles of SCN VIP (c) and extra-SCN VIPin neurons (f) under baseline conditions and during Arch activation. g Mean ± SEM durations of rising and falling phase of the daily peak (time to <half-max) for SCN VIP and extra-SCN VIPin neurons under baseline conditions and during Arch activation. Data for each class was analysed by multilevel mixed-effects linear model (VIP cells—Arch effect: F1,43.72 = 32.94, P > 0.001; Rising vs. falling phase: F1,4.761 = 0.03, P = 0.86; Interaction: F1,43.72 = 0.47, P = 0.50; VIPin cells—Arch effect: F1,36.58 = 5.77, P = 0.02; Rising vs. falling phase: F1,18.72= 0.004, P = 0.95; Interaction: F1,36.58 = 0.22, P = 0.64). h, i Mean ± SEM Arch-driven change in firing rate (h) and firing rate modulation (i; (Arch-spontaneous)/(Arch+spontaneous)) for SCN VIP (blue) and extra-SCN VIPin (purple) neurons across different quartiles of the cells’ daily firing rhythm. In both cases data for each class analysed by multilevel mixed-effects linear model (h VIP cells: F3,38.66 = 7.26, P = 0.001; VIPin cells: F3,21.88 = 5.68, P = 0.005; i VIP cells: F3,15.05 = 0.30, P = 0.88; VIPin cells: F3,139.99 = 4.67, P = 0.004).Tukey’s post-tests were applied where ANOVA reported a significant effect; *P < 0.05, ***P < 0.001.

