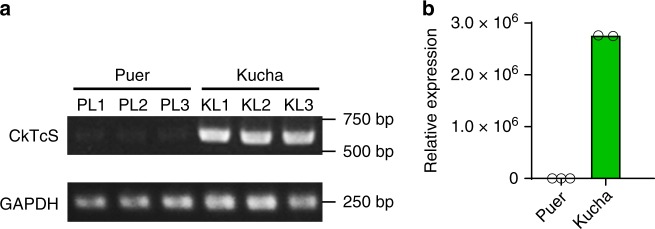
Fig. 3. Transcriptional level analysis of CkTcS gene in Kucha and Puer.
a Qualitative analysis of CkTcS and GAPDH expression in Puer and Kucha. PL1, PL2, PL3, and KL1, KL2, KL3 represent three different leaves from Pure tea plant and Kucha tea plant, respectively. b Quantitative analysis of CkTcS and GAPDH expression in Puer and Kucha by quantitative real-time PCR. The gene expression in each leaf was analyzed at three replicates. The PCR was run for 40 cycles. Expression of CkTcS relative to GAPDH in three Pure leaves versus two Kucha leaves is shown.

