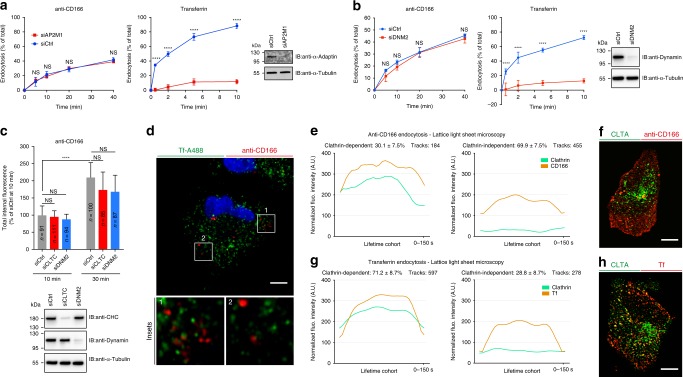
Fig. 1. CD166 is endocytosed in a clathrin- and dynamin-independent manner.
HeLa cells treated with negative control (siCtrl, a–c), or µ2-adaptin (siAP2M1, a), dynamin-2 (siDNM2, b–c), or clathrin heavy chain (siCLTC, c) siRNAs. a, b Measure of anti-CD166 and transferrin (Tf) endocytosis by loss of surface assay in flow cytometry. a Number of independent experiments: anti-CD166, n = 3; Tf, n = 4. b Three independent experiments. NS, not significant. ****P < 0.0001 (RM two-way ANOVA with Bonferroni’s multiple comparison test). c Continuous uptake of anti-CD166 antibody for 10 and 30 min. Internal fluorescence quantified from confocal images and plotted as the relative percentage of siCtrl condition at 10 min. n cells, two independent experiments. NS not significant. ****P < 0.0001 (Kruskal–Wallis test with Dunn’s multiple comparison post hoc test, two-sided). The Western blots against α-adaptin (a), dynamin (b, c), and clathrin heavy chain (c) document the efficiency of siRNAs. Loading control, α-tubulin. d Continuous co-uptake of anti-CD166 antibody (red) and fluorescent Tf (green) for 5 min in HeLa cells. No co-localization between the two markers (see insets). Representative of three independent experiments. e–h Endocytosis imaged by lattice light-sheet microscopy on live cells. Full 3D volume of 60 planes per U2OS cell acquired within 3 s. Average endocytic intensity traces per lifetime, and classification of endocytic events for anti-CD166 (e) and Tf (g) uptake. Green, endogenous genome-edited CLTA-mRFP; Orange, cargo. Lifetime cohorts of endocytic trajectories show a “dome”-shaped intensity profile of cargoes and co-tracking or not with clathrin. f, h 2D projections of acquired 3D stacks of cargo (red), clathrin (green), and overlay (yellow). Representative of ten experiments. All ten experiments were used for quantifications (e, g). Scale bars, 5 µm (d), 10 µm (f, h). Data are mean ± s.e.m. Source data are provided as a Source Data file and in Supplementary Fig. 11 (blots).

