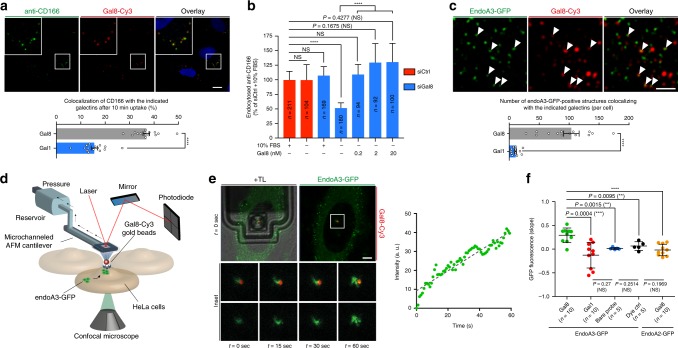
Fig. 3. Galectin-8 drives the uptake of CD166 and induces the recruitment of Endophilin-A3 to endocytic sites at the plasma membrane.
HeLa cells. a Co-incubation with 5 µg ml−1 anti-CD166 antibody and 50 nM fluorescent Galectin-8 (Gal8) for 10 min at 37 °C. Graph, quantifications of co-localization (n = 15 images with 5–15 cells per image). Three independent experiments. ****P < 0.0001 (two-tailed unpaired t test with equal variances). Galectin-1 (Gal1) condition, Supplementary Fig. 9c. b Cells treated with control (siCtrl, red) or Gal8 (siGal8, blue) siRNAs incubated with 5 µg ml−1 anti-CD166 antibody for 10 min at 37 °C in various conditions (graph: ±10% FBS, ±purified Gal8). Intracellular accumulation of anti-CD166 quantified from confocal images. n cells, four independent experiments. NS not significant. ****P < 0.0001 (Kruskal–Wallis test with Dunn’s multiple comparison post hoc test, two-sided). c Cells stably expressing endoA3-GFP incubated with 50 nM fluorescent Gal8 for 10 min at 37 °C. White arrows, co-localization. Graph, number of co-localization events per cell. Number of cells: Gal8, n = 35; Gal1, n = 31 cells. Three independent experiments. ****P < 0.0001 (two-tailed unpaired t test with Welch’s correction). Gal1 condition, Supplementary Fig. 9f. d–f Gal8-induced recruitment of endoA3-GFP at plasma membrane. d Fluid-FM coupled to the confocal setup. Fluorescent galectin-coated gold nanoparticles trapped by microchanneled cantilever and approached to endoA3-GFP-expressing cells. Simultaneous monitoring of galectin (red) and endoA3 (green) fluorescence by fast-scanning confocal microscopy. e Representative images of Fluid-FM/confocal experiments (ten independent measurements). t = 0 s, initial cell exposure to Gal8. TL, transmitted light (cantilever). Insets: area surrounding the beads at the indicated time points. Graph: green fluorescence intensity around beads versus time. Images and plots for Gal1, dye control, bare probe, and endoA2-GFP controls, respectively, Supplementary Fig. 9i–l. f Quantification of fluorescence over time (slopes of linear regressions fitted on intensity vs. time curves). n-independent measures. NS not significant. **P < 0.01, ***P < 0.001 (two-tailed unpaired t tests). Scale bars, 10 µm (a), 1 µm (c), and 5 µm (e). Data are mean ± s.e.m. (a, c, f) or median ± 95% CI. b Source data are provided as a Source Data file.

