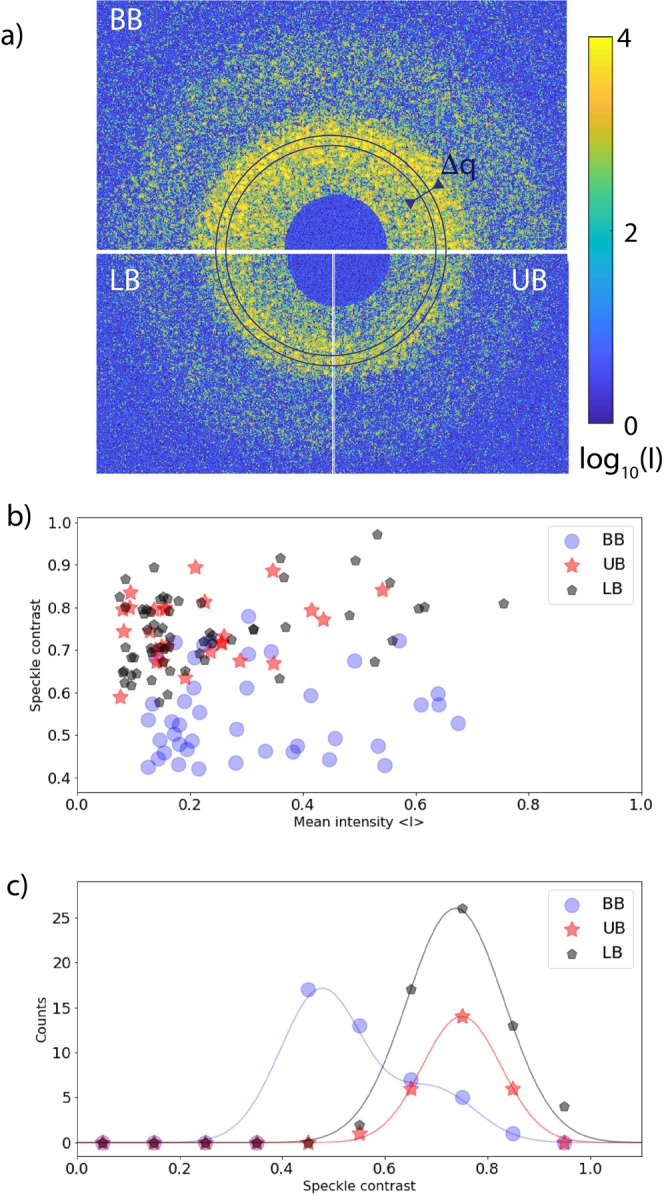
Figure 3.

(a) Speckle patterns measured from the static sample with the split-and-delay unit configured in upper branch (UB), lower branch (LB) and both branches (BB). For these measurements, the delay was set to 20 ps. (b) Speckle contrast β as a function of the mean photon FEL pulse intensity taken with the upper, lower and both branches, respectively. (c) Observable contrast for upper, lower, both branches, respectively. Solid lines are Gaussian fits to corresponding speckle contrast distributions.
