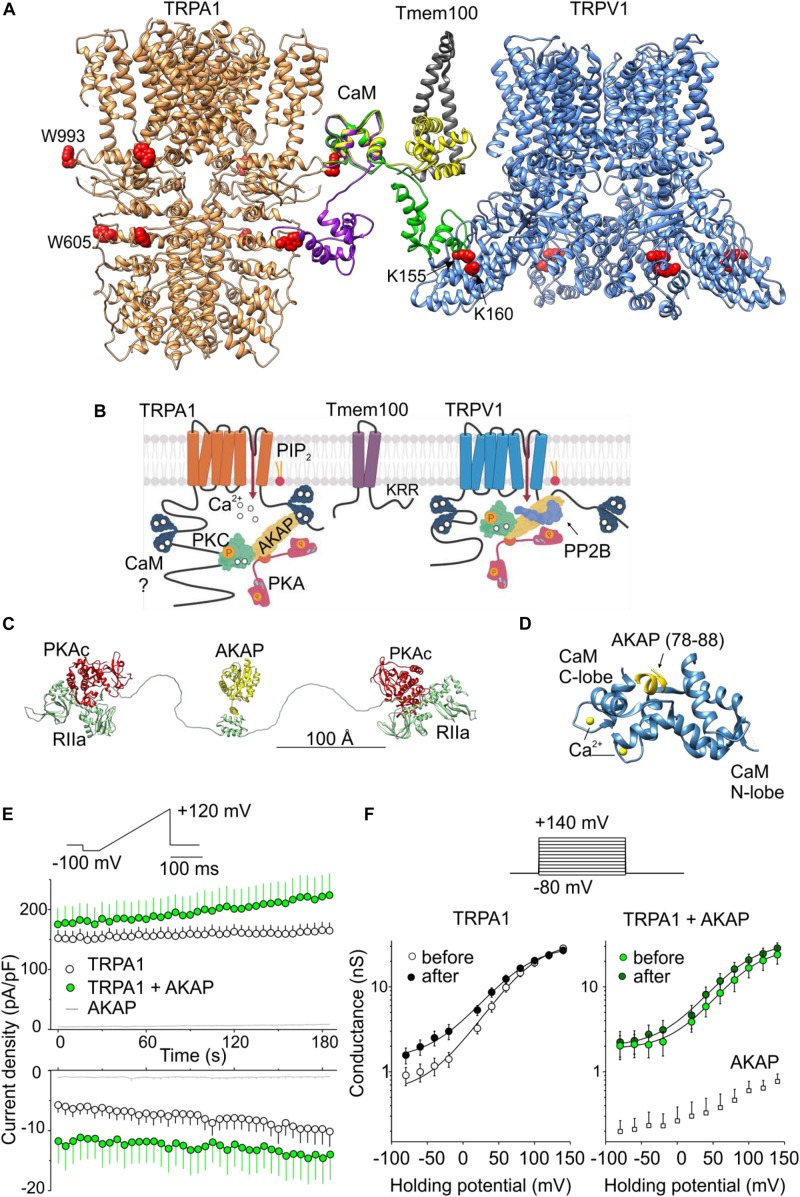
FIGURE 2.
Regulation of TRPA1 by phosphorylation and by predicted interactions with modulatory and scaffold proteins. (A) N- and C-lobes of Ca2+/CaM (three conformers are shown in violet, green, and yellow) are capable of binding to TRPA1 but also serving as a linker binding either TRPA1 to the Tmem100 (gray ribbon) membrane protein or to the cytoplasmic binding site in the N-terminus of TRPV1. Tryptophans putatively involved in Ca2+/CaM binding are shown as red side chains. (B) Permeating Ca2+ binds to calmodulin (forming a complex Ca2+/CaM), phosphatidylinositol-4,5-bisphosphate (PIP2) competes with Ca2+/CaM for binding to TRPA1. A kinase anchoring protein AKAP79/150 (AKAP) binds to TRPA1 and functions as a signaling scaffold for protein kinase A (PKA) and C (PKC). The activation of PKA or PKC sensitizes TRPA1 by phosphorylation (P in orange circles). The interaction of TRPA1 with TRPV1 is regulated by the transmembrane adaptor protein Tmem100 via the amino acid KRR triplet on the C-terminus of Tmem100. AKAP also binds to TRPV1 and associates with protein phosphatase 2B (PP2B, calcineurin) to effectively dephosphorylate the channel. (C) Extended linear configuration (the end-to-end length ∼385 Å) of pseudo-atomic model of pentameric protein assembly of AKAP (AKAP18γ, residues 88–317) connected to regulatory subunits (RIIα) with associated catalytic subunits (PKAc) of PKA [PDB ID: 3j4R; (Smith et al., 2013)]. (D) Published crystal structure of CaM (steel blue ribbon) in complex with AKAP79 peptide (yellow). Two EF hands of the C-lobe coordinate Ca2+ (yellow atoms). One of the two copies of the published structure is shown: PDB ID: 5NIN, chains A and C. (E) Average whole-cell current densities induced by depolarizing voltage measured from HEK293T cells expressing TRPA1 (white circles indicating mean ± SEM; n = 17), or TRPA1 together with AKAP79 (green circles indicating mean ± SEM; n = 13). Voltage ramp protocol (shown in upper trace) was applied repeatedly each 5 s for 3 min. Amplitudes were measured at –100 mV and +100 mV and plotted as a function of time. Mean current densities measured from HEK293T cells transfected only with AKAP79 and control plasmid are shown as light gray lines with ± SEM (n = 4); absent error bars are smaller than the line thickness. (F) Average conductances measured at the end of pulses from currents induced by voltage-step protocol (shown above): 100-ms steps from –80 mV to +140 mV (increment +20 mV), holding potential –70 mV. Currents were measured from TRPA1 or TRPA1 together with AKAP79 before (white and light green circles) and after (black and dark green circles) the train of ramp pulses as shown in (E). The data represent the mean ± SEM (n = 12 and 9, respectively). The solid lines represent the best fit to a Boltzmann function as described in (Zimova et al., 2018). Average conductances obtained from three HEK293T cells transfected with AKAP79 together with control plasmid are shown as white squares +SEM.
Using depolarizing voltage ramps from –100 mV to +100 mV under whole-cell patch clamp conditions, we measured TRPA1-mediated responses from HEK293T cells transfected with wild-type human TRPA1 or wild-type human TRPA1 together with the voltage-dependent phosphatase cloned from Danio rerio (Dr-VSP) to selectively deplete PIP2 (Hossain et al., 2008; Okamura et al., 2009; Zimova et al., 2018; Figure 1A). We applied 20 s steps from 25°C to 15°C and to 35°C first in control extracellular solution and then in 50 μM carvacrol, the non-electrophilic agonist of TRPA1. At positive membrane potentials the current responses were not significantly different, indicating comparable expression levels. The comparison at −80 mV indicates that an acute level of membrane PIP2 regulates both the rate and extent of the response to individual stimuli (cold temperature or agonist) but does not affect the synergy between the stimuli (Figures 1B,C). Using the same voltage protocol, we measured currents from cells expressing the H1018R mutant (Figure 1D). Notably, the H1018R mutant exhibited significantly increased current responses at −80 mV upon the simultaneous application of agonist and cooling (Figure 1E). The voltage dependence of cold activation (Figure 1F) illustrates the opposite effects of the H1018R mutation and the acute PIP2 depletion. To find where negatively charged PIP2 will most likely be bound, we used the structure of human TRPA1 [Protein Data Bank (PDB) ID: 6PQQ; (Suo et al., 2020)]. By means of the “Mutate residue” plugin in VMD software (Humphrey et al., 1996), H1018 was mutated to R1018. The “PME Electrostatics” module of VMD was used to compute electrostatic maps, which were visualized with UCSF Chimera (Pettersen et al., 2004). As shown in Figures 1G–I, the H1018R mutation substantially extended the positive electrostatic potential surrounding the allosteric nexus formed by the cytoplasmic region situated just below the transmembrane core, indicating an increased probability of PIP2 binding (see also the Supplementary Material).
These results further substantiate the previously proposed role of the proximal C-terminal linker in the PIP2-mediated regulation of TRPA1, and also indicate that the cold sensitivity of the channel can be modulated by membrane lipids. Consistent with our results, the allosteric nexus containing this region has been recently proposed to be an important determinant for phospholipid binding as well as for TRPA1 gating (Zhao et al., 2019; Suo et al., 2020).
At present, however, it is not clear to what extent the results may reflect the situation in vivo and how the effects observed with the H1018R mutant may relate to human asthma. We have recently demonstrated that the cold sensitivity of human TRPA1 is similar in both HEK293T cells and also in F11 cells, which are a well characterized cellular model of peripheral sensory neurons (Sinica et al., 2019). Although the TRPA1-mediated cold responses do not differ between these two cellular models, PIP2 signaling and H1018R expression could differ among various cell types.

